

Cropland expansion changes deforestation dynamics in the southern Brazilian Amazon
- PMID: 16973742
- PMCID: PMC1600012
- DOI: 10.1073/pnas.0606377103
Cropland expansion changes deforestation dynamics in the southern Brazilian Amazon
Abstract
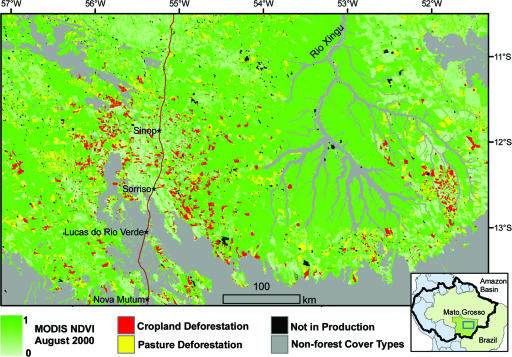
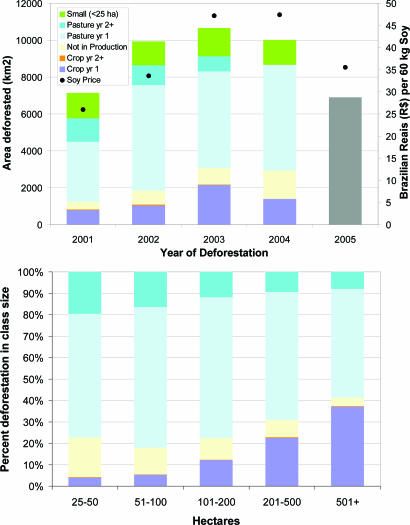
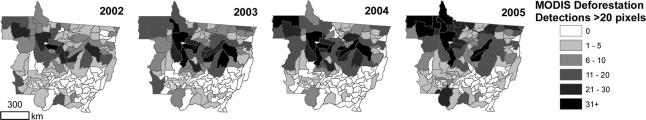
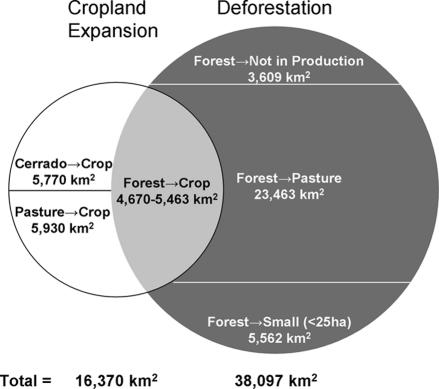
Intensive mechanized agriculture in the Brazilian Amazon grew by >3.6 million hectares (ha) during 2001-2004. Whether this cropland expansion resulted from intensified use of land previously cleared for cattle ranching or new deforestation has not been quantified and has major implications for future deforestation dynamics, carbon fluxes, forest fragmentation, and other ecosystem services. We combine deforestation maps, field surveys, and satellite-based information on vegetation phenology to characterize the fate of large (>25-ha) clearings as cropland, cattle pasture, or regrowing forest in the years after initial clearing in Mato Grosso, the Brazilian state with the highest deforestation rate and soybean production since 2001. Statewide, direct conversion of forest to cropland totaled >540,000 ha during 2001-2004, peaking at 23% of 2003 annual deforestation. Cropland deforestation averaged twice the size of clearings for pasture (mean sizes, 333 and 143 ha, respectively), and conversion occurred rapidly; >90% of clearings for cropland were planted in the first year after deforestation. Area deforested for cropland and mean annual soybean price in the year of forest clearing were directly correlated (R(2) = 0.72), suggesting that deforestation rates could return to higher levels seen in 2003-2004 with a rebound of crop prices in international markets. Pasture remains the dominant land use after forest clearing in Mato Grosso, but the growing importance of larger and faster conversion of forest to cropland defines a new paradigm of forest loss in Amazonia and refutes the claim that agricultural intensification does not lead to new deforestation.
Conflict of interest statement
The authors declare no conflict of interest.
Figures
Comment in
-
Mapping land use of tropical regions from space.Proc Natl Acad Sci U S A. 2006 Sep 26;103(39):14261-2. doi: 10.1073/pnas.0606804103. Epub 2006 Sep 19. Proc Natl Acad Sci U S A. 2006. PMID: 16985002 Free PMC article. No abstract available.
References
-
- Food and Agriculture Organization of the United Nations. Global Forest Resources Assessment 2005: Progress Towards Sustainable Forest Managment. Rome, Italy: Food and Agriculture Organization, United Nations; 2006.
-
- Giglio L, Csiszar I, Justice CO. J Geophys Res. 2006;111 G02016.
-
- Houghton RA, Skole DL, Nobre CA, Hackler JL, Lawrence KT, Chomentowski WH. Nature. 2000;403:301–304. - PubMed
-
- Lambin EF, Geist HJ. Environment. 2003;45:22–36.
-
- Fearnside PM. Conserv Biol. 2005;19:680–688.
Publication types
MeSH terms
LinkOut - more resources
Full Text Sources
