. 2006 Sep 15;2(9):e123.
doi: 10.1371/journal.pcbi.0020123. Epub 2006 Jul 31.

Transcriptional dynamics of the embryonic stem cell switch

Affiliations

Transcriptional dynamics of the embryonic stem cell switch

Vijay Chickarmane et al. PLoS Comput Biol. .

Abstract

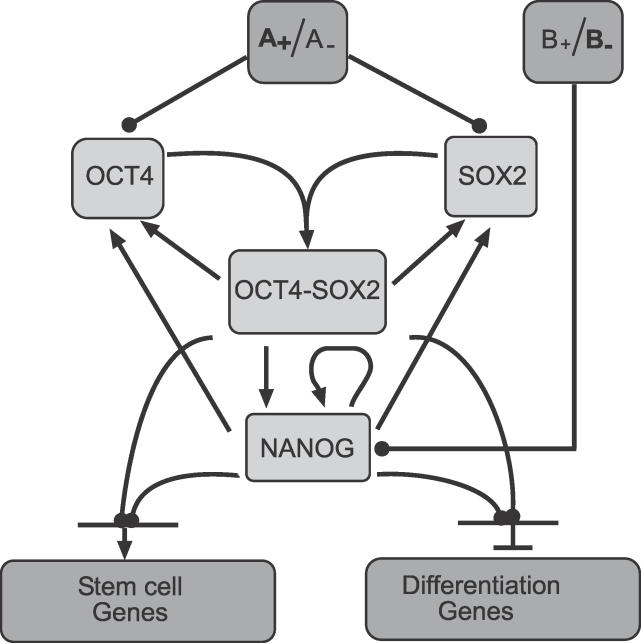
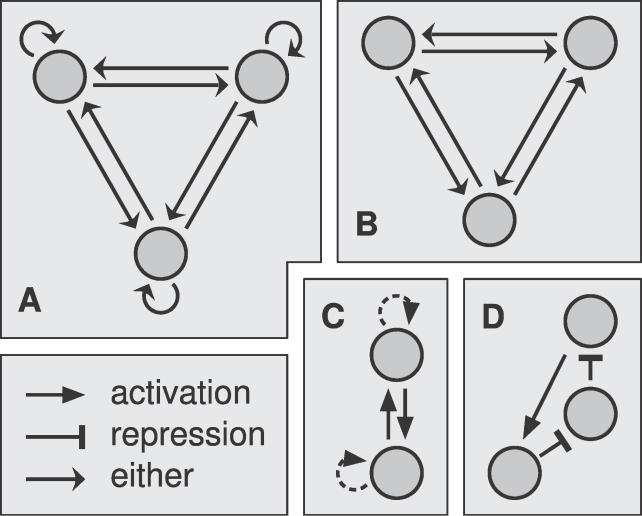
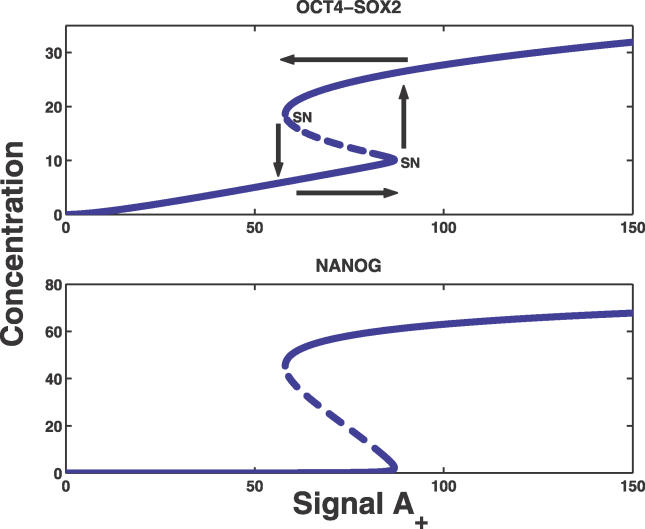
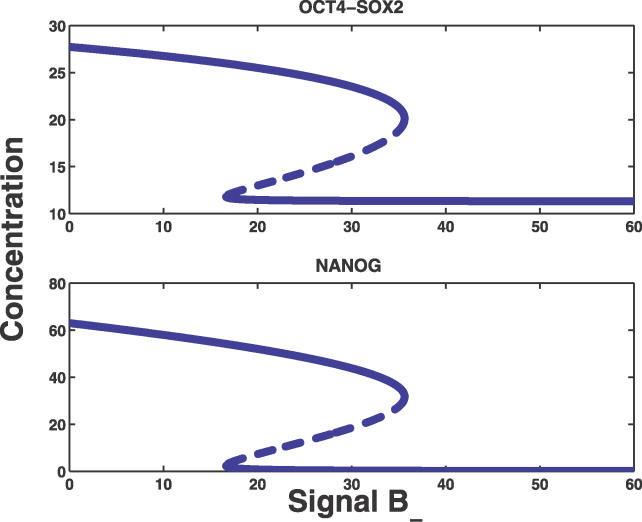
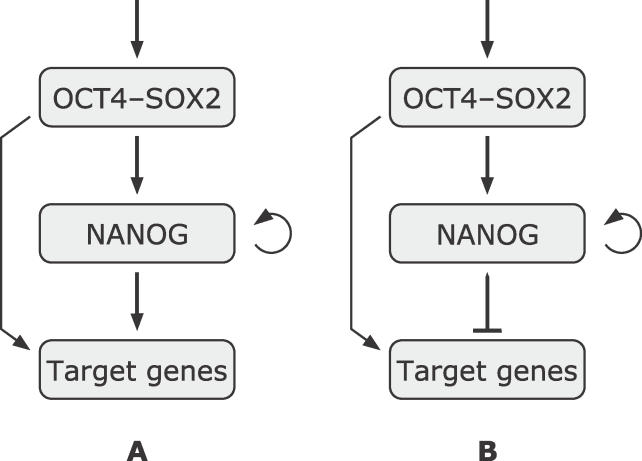
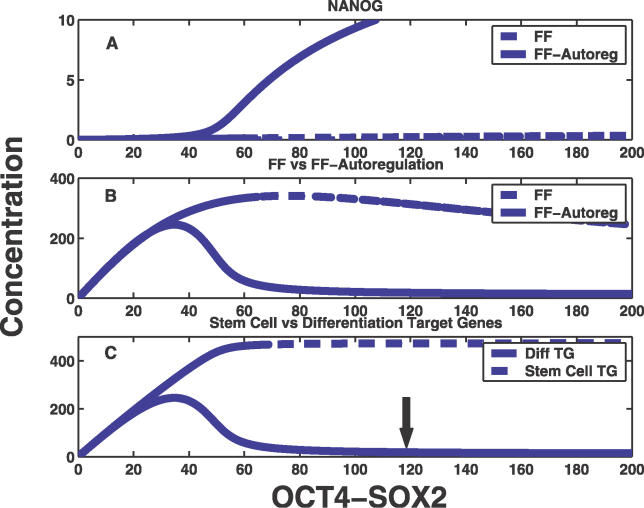
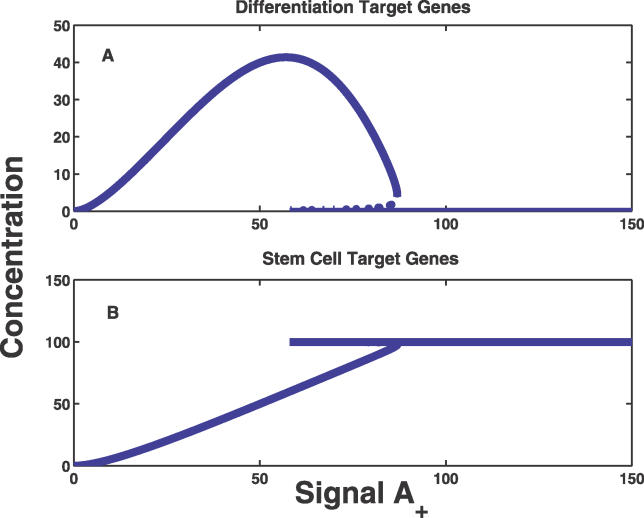
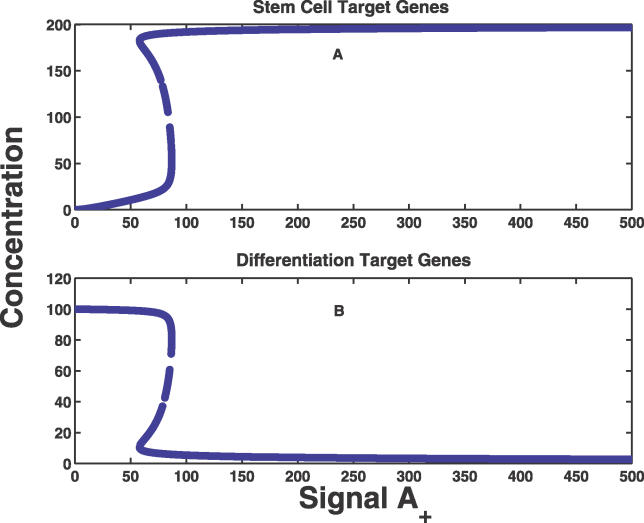
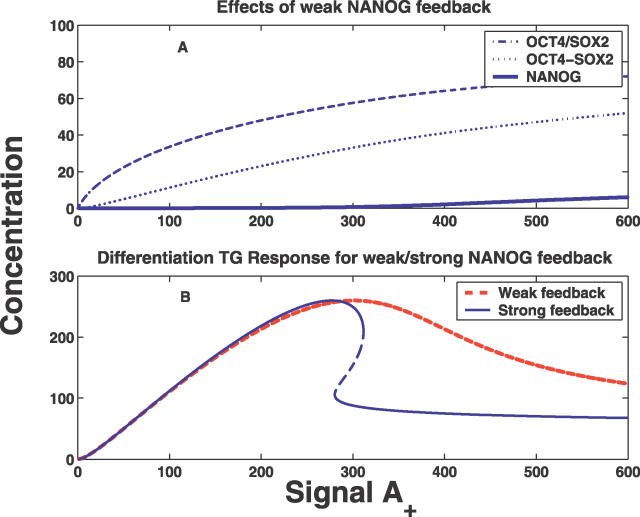
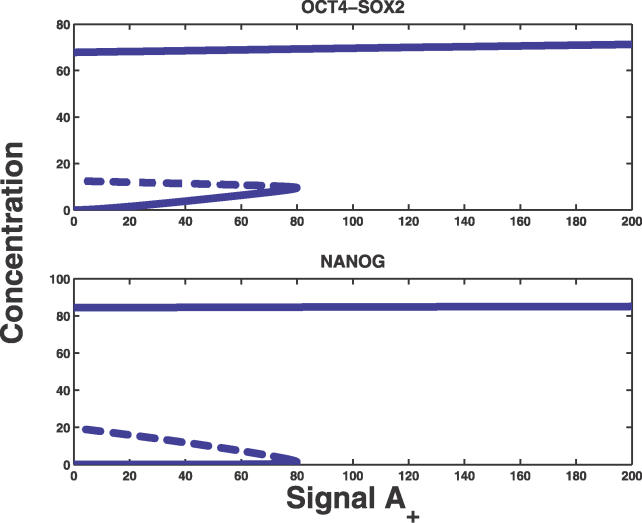
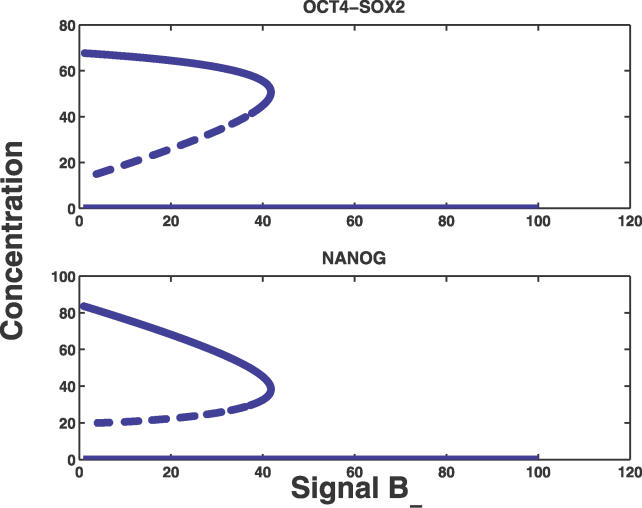
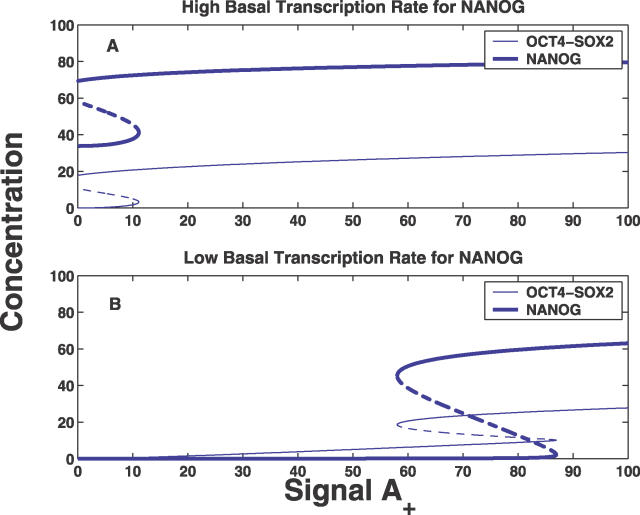
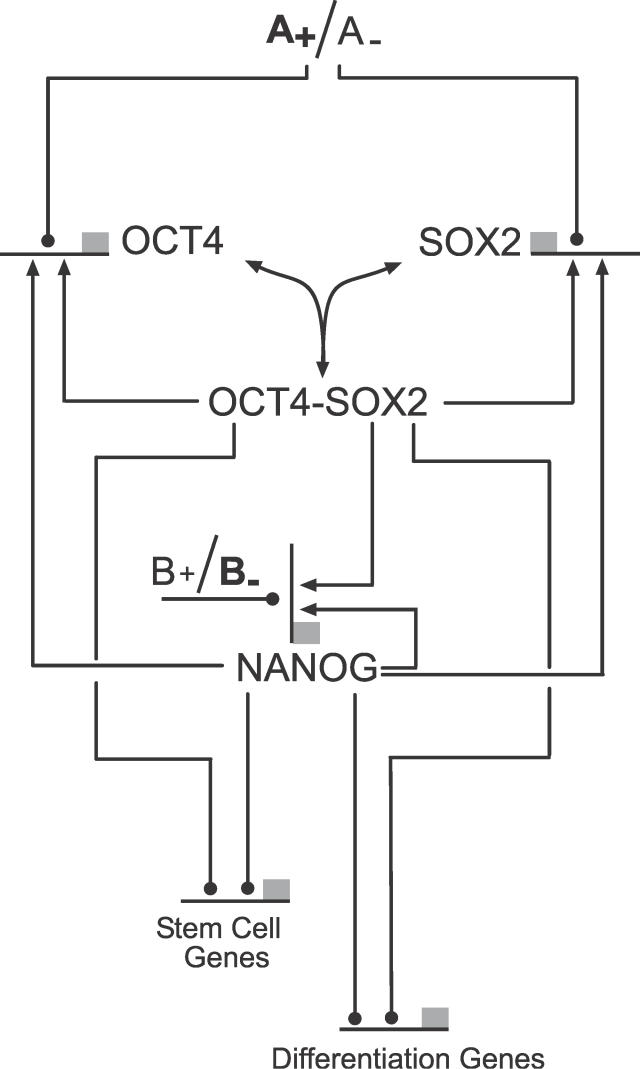
Recent ChIP experiments of human and mouse embryonic stem cells have elucidated the architecture of the transcriptional regulatory circuitry responsible for cell determination, which involves the transcription factors OCT4, SOX2, and NANOG. In addition to regulating each other through feedback loops, these genes also regulate downstream target genes involved in the maintenance and differentiation of embryonic stem cells. A search for the OCT4-SOX2-NANOG network motif in other species reveals that it is unique to mammals. With a kinetic modeling approach, we ascribe function to the observed OCT4-SOX2-NANOG network by making plausible assumptions about the interactions between the transcription factors at the gene promoter binding sites and RNA polymerase (RNAP), at each of the three genes as well as at the target genes. We identify a bistable switch in the network, which arises due to several positive feedback loops, and is switched on/off by input environmental signals. The switch stabilizes the expression levels of the three genes, and through their regulatory roles on the downstream target genes, leads to a binary decision: when OCT4, SOX2, and NANOG are expressed and the switch is on, the self-renewal genes are on and the differentiation genes are off. The opposite holds when the switch is off. The model is extremely robust to parameter changes. In addition to providing a self-consistent picture of the transcriptional circuit, the model generates several predictions. Increasing the binding strength of NANOG to OCT4 and SOX2, or increasing its basal transcriptional rate, leads to an irreversible bistable switch: the switch remains on even when the activating signal is removed. Hence, the stem cell can be manipulated to be self-renewing without the requirement of input signals. We also suggest tests that could discriminate between a variety of feedforward regulation architectures of the target genes by OCT4, SOX2, and NANOG.


Conflict of interest statement

Competing interests. The authors have declared that no competing interests exist.

Figures

Figure 1
Figure 1. The Core Transcriptional Network of the ES Cell
Genes and proteins are represented as single entities. Each outgoing arrow represents a protein (the outgoing merging arrows from OCT4 and SOX2 represent complex formation). Each ingoing arrow represents a protein with a role as a TF. Signals A +, e.g., the wnt signaling protein, triggers the system to sustain self-renewal and pluripotency, whereas signals B , e.g., p53, shuts it off, thereby leading to differentiation. It should be noted that there are also signals A that repress OCT4 and SOX2. These variants are not shown here since the effects will be similar to those of B . OCT4, SOX2, and NANOG individually as well as jointly target stem cell and differentiation genes. We model the set of TGs that are jointly regulated by OCT4, SOX2, and NANOG. The nature of the regulation at the TGs is not specified, since we explore all the possibilities. However, the final effect of the regulation is indicated.
Figure 2
Figure 2. Putative Network Motifs Related to the System of OCT4, SOX2, and NANOG
The motif in (A) captures the regulatory interactions of the system at the gene–gene level. Because (A) was not observed in any of the databases for lower organisms (see text), we searched for the same subgraph without autoregulations (B), followed by its two-gene counterpart with positive regulation (C). Finally, one of the activations was replaced with two repressions in series, yielding (D). A small number of instances of (C) and (D) were found in the databases (see text).
Figure 3
Figure 3. Steady State Behavior of the OCT4–SOX2 and NANOG Concentration Levels as Functions of the Signal A +
There are two turning points (saddle-node bifurcations are marked as SN, and the dotted line connecting the SNs indicate unstable states) leading to a hysteretic curve. The arrows indicate how to interpret the hysteresis curve. As A + is increased beyond A ≈ 87 (arbitrary units), the system switches on, and thereafter as the stimulus is decreased below A ≈ 58, the switch turns off. The on/off states refer to high/low levels of OCT4, SOX2, and NANOG.
Figure 4
Figure 4. Steady State Behavior of OCT4–SOX2 and NANOG Concentration Levels as a Function of the Signal B
The system is a bistable switch with respect to the B concentration. As the threshold is crossed (B ≈ 36, arbitrary units), NANOG turns off, and OCT4 and SOX2 are reduced to lower levels. Since the signal is still present (A + = 100), the OCT4 and SOX2 levels do not decline to very low levels.
Figure 5
Figure 5. Coherent and Incoherent Feedforward Network Motifs
(A) Coherent. (B) Incoherent.
Figure 6
Figure 6. Steady State Concentrations of NANOG and the TGs as Functions of the Input OCT4–SOX2 Concentration [OS] for the Feedforward Motif with Autoregulation (FF-Autoreg) as well as the Feedforward Motif with No Autoregulation (FF)
(A) NANOG. (B) TGs. (C) Concentrations of the stem cell and differentiation TGs as a function of [OS] are shown. The arrow in (C) indicates that if such a value of [OS] is reached, then the differentiation TGs could be shut off, whereas the stem cell TGs would be on. Thus the same incoherent architecture for both sets of genes achieves the desired result.
Figure 7
Figure 7. Steady State Values of the TG Expression as a Function of the Input Concentration A + for the Differentiation and Stem Cell Genes Using for the Integrated Model with the Incoherent Feedforward Architecture Differentiation TG Expression and Stem Cell TG Expression
(A) Differentiation TG expression. (B) Stem cell TG expression. Once the stem cell box is on, the [OS] levels are fixed by the switch: for example, if it is larger than 100, the stem cell genes are expressed and the differentiation genes are shut off.
Figure 8
Figure 8. Steady State Values of the TG Expression as a Function of the Input Concentration A + for Stem Cell and Differentiation Genes, Respectively, for Case II
(A) Stem cell genes. (B) Differentiation genes.
Figure 9
Figure 9. Steady State Values of TG Expression as a Function of the Input Concentration A +, for the Differentiation and Sel-Renewal Genes for the Case when NANOG Binds Weakly/Strongly to the OCT4 and SOX2 Genes
(A) The effects of weak feedback of NANOG to the OCT4 and SOX2 genes. The inefficient binding of NANOG to these genes leads to a loss of the switch-like behavior. (B) The consequence of weak NANOG binding on the TG expression. With weak feedback, the expression level does not fall off sharply as compared with the case with strong feedback, thereby demonstrating that strong feedback is essential to prevent the differentiation TGs from being expressed.
Figure 10
Figure 10. Steady State Concentrations of OCT4–SOX2 and NANOG as Functions of the Signal A +
There is only one turning point leading to an irreversible bistable switch. At the threshold A + 80, the system switches on and remains on even when the stimulus is removed.
Figure 11
Figure 11. Steady State Concentrations of OCT4–SOX2 and NANOG as Functions of the Signal B
At the threshold B ≈ 41 the system switches off and remains permanently off even when B is removed.
Figure 12
Figure 12. The Effects of Overexpression of NANOG on the OCT4–SOX2 and NANOG Concentration
(A) Shows the OCT4–SOX2 and NANOG concentration showing irreversible bistability, when NANOG is overexpressed through a high value for the basal rate of transcription (i.e., η 5). Hence its expression remains on even on removal of the signal A +. (B) Shows OCT4–SOX2 and NANOG concentrations (the same as in Figure 3) exhibiting bistable behavior, which have negligible basal rates of transcription for NANOG, but which require the signal for the stem cell box to be on.
Figure 13
Figure 13. Stoichiometric Map of the Model Corresponding to Figure 1
All protein species are assumed to have a first-order degradation rate. The lines ending with dots could be either activating or repressing, depending on the choice of model.

References

    1. Chambers I, Colby D, Robertson M, Nichols J, Lee S, et al. Functional expression cloning of Nanog, a pluripotency sustaining factor in embryonic stem cells. Cell. 2003;113:643–655. - PubMed
    1. Mitsui K, Tokuzawa Y, Itoh H, Segawa K, Murakami M, et al. The homeoprotein Nanog is required for maintenance of pluripotency in mouse epiblast and ES cells. Cell. 2003;113:631–642. - PubMed
    1. Boyer LA, Lee TI, Cole MF, Johnstone SE, Levine SS, et al. Core transcriptional regulatory circuitry in human embryonic stem cells. Cell. 2005;122:947–956. - PMC - PubMed
    1. Loh Y-H, Wu Q, Chew J-L, Vega VB, Zhang W, et al. The Oct4 and Nanog transcription network regulates pluripotency in mouse embryonic stem cells. Nat Gen. 2006;38:431–440. - PubMed
    1. Ying QL, Nichols J, Chambers I, Smith A. BMP induction of Id proteins suppresses differentiation and sustains embryonic stem cell self-renewal in collaboration with STAT3. Cell. 2003;115:281–292. - PubMed

Publication types

Substances