. 2006 Sep 15:7:63.
doi: 10.1186/1471-2202-7-63.

Geometric morphometrics defines shape differences in the cortical area map of C57BL/6J and DBA/2J inbred mice

Affiliations

Geometric morphometrics defines shape differences in the cortical area map of C57BL/6J and DBA/2J inbred mice

David C Airey et al. BMC Neurosci. .

Abstract

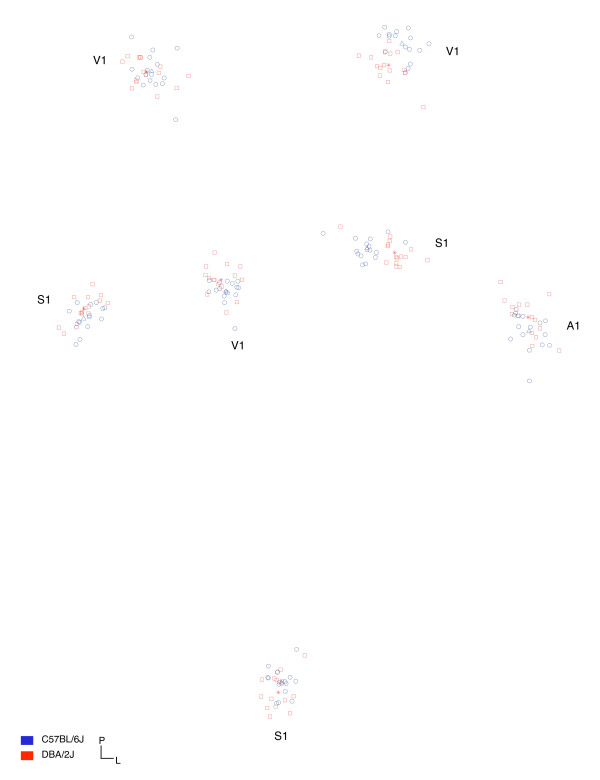
Background: We previously described planar areal differences in adult mouse visual, somatosensory, and neocortex that collectively discriminated C57BL/6J and DBA/2J inbred strain identity. Here we use a novel application of established methods of two-dimensional geometric morphometrics to examine shape differences in the cortical area maps of these inbred strains.

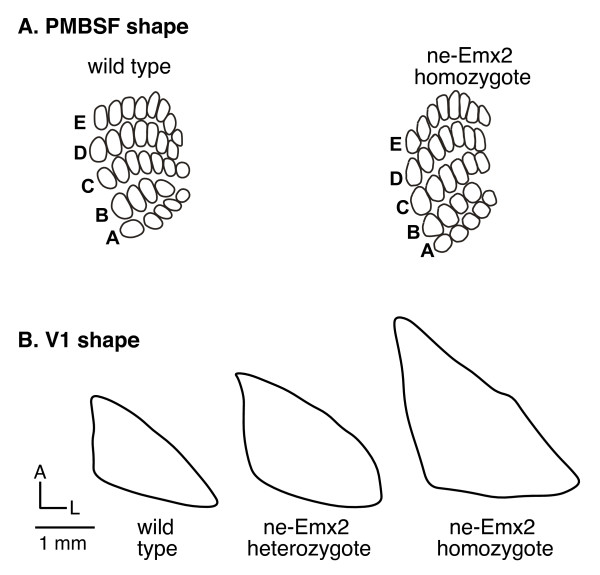
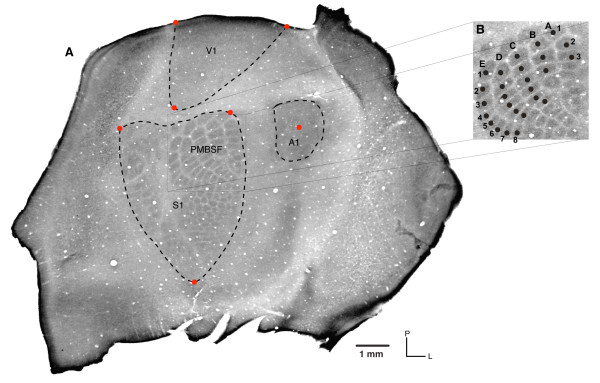
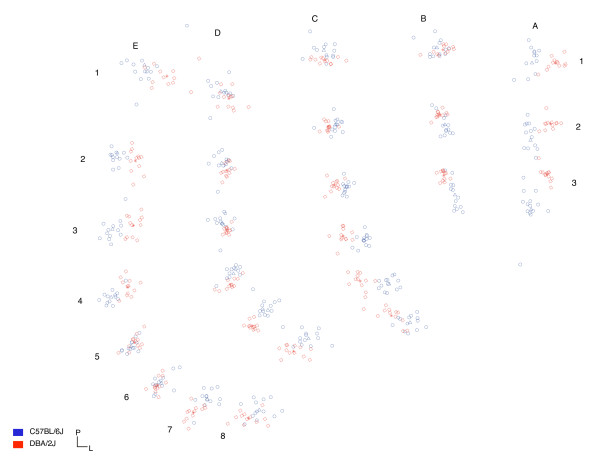
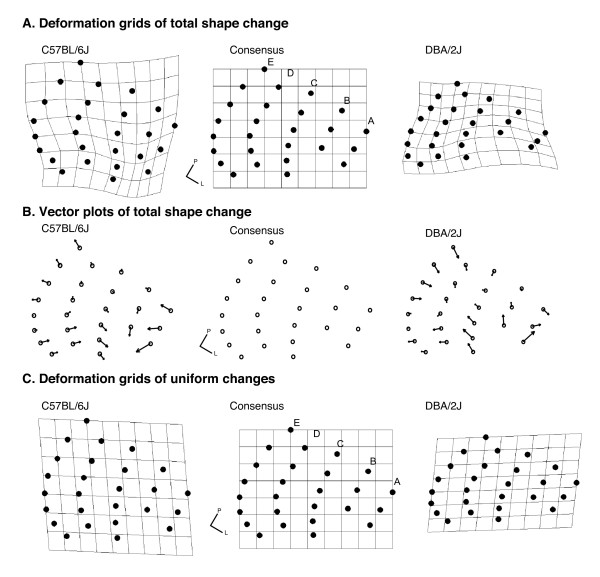
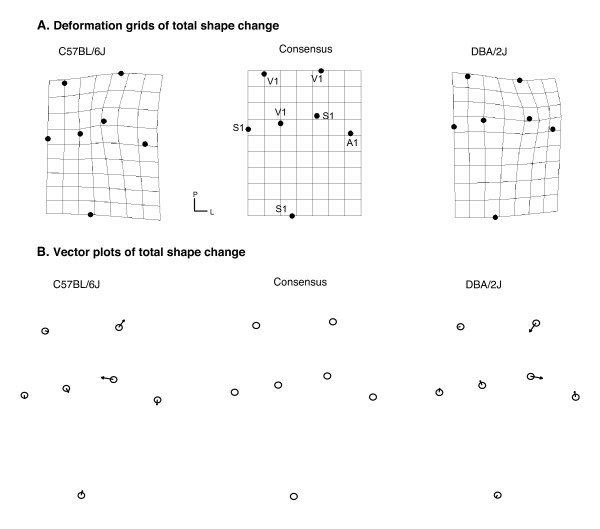
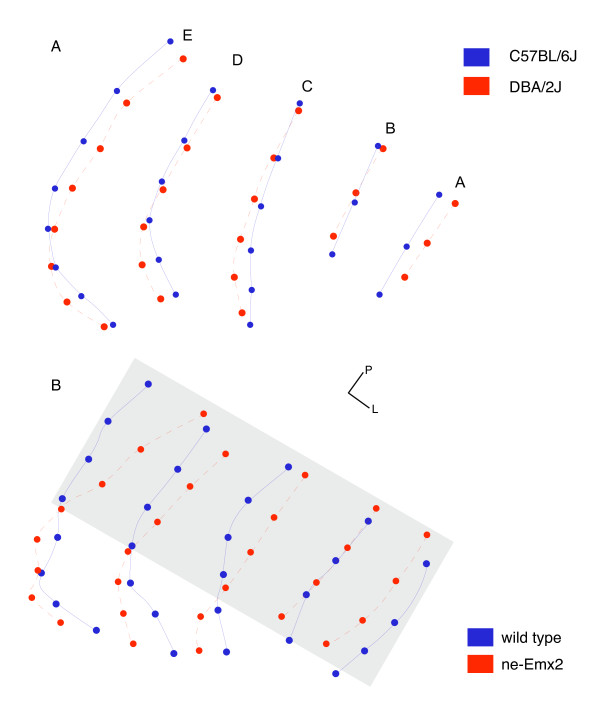
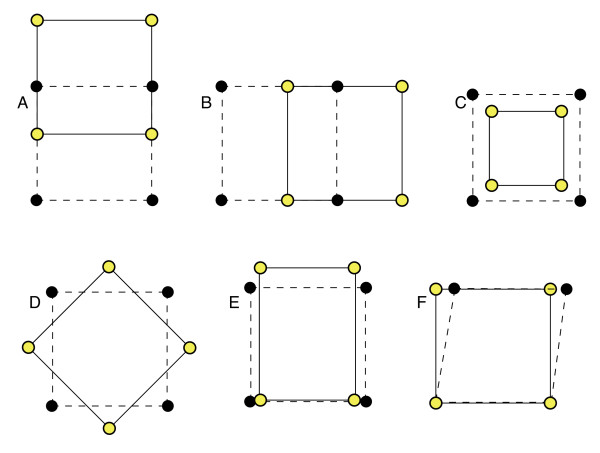
Results: We used Procrustes superimposition to align a reliable set of landmarks in the plane of the cortical sheet from tangential sections stained for the cytochrome oxidase enzyme. Procrustes superimposition translates landmark configurations to a common origin, scales them to a common size, and rotates them to minimize an estimate of error. Remaining variation represents shape differences. We compared the variation in shape between C57BL/6J and DBA/2J relative to that within each strain using a permutation test of Goodall's F statistic. Significant differences in shape in the posterior medial barrel subfield (PMBSF), as well as differences in shape across primary sensory areas, characterize the cortical area maps of these common inbred, isogenic strains.

Conclusion: C57BL/6J and DBA/2J have markedly different cortical area maps, in both size and shape. These differences suggest polymorphism in genetic factors underlying cortical specification, even between common isogenic strains. Comparing cortical phenotypes between normally varying inbred mice or between genetically modified mice can identify genetic contributions to cortical specification. Geometric morphometric analysis of shape represents an additional quantitative tool for the study of cortical development, regardless of whether it is studied from phenotype to gene or gene to phenotype.


Figures

Figure 1
Figure 1
Emx2 cortical area map phenotypes. Outline drawings of cortical map phenotypes in wild type mice and mice over expressing Emx2 show changes in the shape of PMBSF and V1. 1A shows PMBSF for wild-type and ne-Emx2 homozygote. 1B shows V1 drawings from wild-type, ne-Emx2 heterozygote, and ne-Emx2 homozygote. Rostral is up, lateral is right. In both areas, increasing Emx2 expression produces rostral elongation, although in PMBSF the lateral edge appears more affected than the medial edge. Drawings have been adapted from [5] with permission from Dr. D. D. O'Leary.
Figure 2
Figure 2
Cortical landmarks. (2A) A cytochrome oxidase stained tangential cortex section with locations of landmarks indicated in V1, S1, and A1. For V1 and S1, medial-, lateral-, and rostral-most corners were used. For A1, the centroid of the bounded region was used. (2B) For the PMBSF (inset), the centroid of each drawn barrel was used. Rostral is down, lateral is right.
Figure 3
Figure 3
PMBSF Procrustes scatterplot. Procrustes superimposition of 26 barrel landmarks from each of 13 adult C57BL/6J mice and 12 adult DBA/2J mice. C57BL/6J is shown in blue circles. DBA/2J is shown in red squares. Blue triangles show C57BL/6J strain means. Red stars show DBA/2J strain means. Barrel identity is indicated as labeled. The figure shows the actual spread in the superimposed data, but also indicates the shape differences. One can readily discern strain differences in the position of any barrel by noting the relative separation by color for any given landmark point cloud. For example, in barrel A1, the red squares (DBA/2J) are lateral of the blue circles (C57BL/6J) and show no overlap. A similar lateral difference is seen in the point clouds for barrels A2 and A3, although the blue circles become progressively shifted anteriorly. See Figure [4] and text for a more complete description of noted shape changes. Figure [3] was composed in TwoGroup, a shape software title in the IMP series described in [9].
Figure 4
Figure 4
PMBSF deformation grids and vector plots. Deformation grids and vector plots of PMBSF landmarks. Whereas Figure 3 emphasizes the animal variation in shape grouped by strain, increased emphasis on the overall shape differences between strains is better illustrated by deformation grids and vector plots, two standard plot types for shape change depiction. 4A depicts total (uniform and non-uniform) shape differences in C57BL/6J, the consensus plot, and DBA/2J. The consensus (jargon of geometric morphometrics) represents the average, or midway interpolation, of the two strains. 4B shows vector plots of C57BL/6J and DBA/2J shapes, where the vector size is proportional to the observed changes. The noted shape changes in barrel row A mentioned in the caption for Figure 3 are more readily apparent in Figure 4A and 4B. See text for a more complete description of noted shape changes. 4C shows deformation grids of only the uniform effects, and so the grid lines are parallel. Effects in these plots have been increased 3-fold to better illustrate the differences between strains. The figures were composed in tpsRegr [32].
Figure 5
Figure 5
V1, S1, and A1 Procrustes scatterplot. Procrustes superimposition of 7 cortical landmarks from each of 16 adult C57BL/6J mice and f5 adult DBA/2J mice. C57BL/6J is shown in blue circles. DBA/2J is shown in red squares. Blue triangles show C57BL/6J strain means. Red stars show DBA/2J strain means. The figure shows the actual spread in the superimposed data, but also indicates the shape differences. One can readily discern strain differences in the position of any landmark by noting the relative separation by color for any given landmark point cloud. For example, the lateral posterior landmark for V1 and for S1 show little overlap between blue circles and red squares. See Figure 6 and text for a more complete description of noted shape changes. The figure was composed in TwoGroup [9].
Figure 6
Figure 6
V1, S1, and A1 deformation grids and vector plots. Deformation grids and vector plots of the primary sensory cortex landmarks. Whereas Figure 5 emphasizes the animal variation in shape grouped by strain, increased emphasis on the overall shape differences between strains is better illustrated by deformation grids and vector plots, two standard plot types for shape change depiction. 6A shows deformation grids for C57BL/6J, the consensus, and DBA/2J. 6B shows vector plots for C57BL/6J and DBA/2J, where the vector size is proportional to the observed changes. Effects in these plots have been increased 3-fold to better illustrate the differences between strains in the raw scale scatterplots above. See text for a more complete description of noted shape changes. The figures were composed in tpsRegr [32].
Figure 7
Figure 7
PMBSF Procrustes superimposition in ne-Emx2 mice. (7A) Procrustes superimposition of 26 barrel landmarks from C57BL/6J (blue) and DBA/2J (red) emphasizing the strain means from Figure 3 above. (7B) Procrustes superimposition of barrels from one wild-type mouse (blue) and one ne-Emx2 mouse (red) from figure 3 of [5] (original figure provided by D.D. O'Leary). In 7B we note two main shape differences. The first is highlighted by the gray box. Wild-type PMBSF shows lateral stretching relative to ne-Emx2 mice for the posterior parts of barrel rows A to E. Second, in the area not highlighted by the gray box (anterior ends of rows C, D, and E), there is rostral stretching in ne-Emx2 mice. This aspect is similar to the effect seen in DBA/2J versus C57BL/6J.
Figure 8
Figure 8
Uniform transformations. There are six uniform transformations. Translation in X (8A) or in Y (8B), scaling (8C), and rotation (8D) do not alter shape, and are removed prior to shape analysis. Translation, scaling, and rotation are not components of shape change, because shape is by definition invariant to these transformations. Compression (8E) and shearing (8F) do alter shape, but are different from non-uniform shape components. Reprinted from [9], page 136, with permission from Elsevier.

References

    1. O'Leary D, Nakagawa Y. Patterning centers, regulatory genes and extrinsic mechanisms controlling arealization of the neocortex. Curr Opin Neurobiol. 2002;12:14–25. doi: 10.1016/S0959-4388(02)00285-4. - DOI - PubMed
    1. Grove E, Fukuchi-Shimogori T. Generating the cerebral cortical area map. Annu Rev Neurosci. 2003;26:355–380. doi: 10.1146/annurev.neuro.26.041002.131137. - DOI - PubMed
    1. Rash B, Grove E. Area and layer patterning in the developing cerebral cortex. Curr Opin Neurobiol. 2006;16:25–34. doi: 10.1016/j.conb.2006.01.004. - DOI - PubMed
    1. Mallamaci A, Stoykova A. Gene networks controlling early cerebral cortex arealization. Eur J Neurosci. 2006;23:847–856. doi: 10.1111/j.1460-9568.2006.04634.x. - DOI - PubMed
    1. Hamasaki T, Leingartner A, Ringstedt T, O'Leary D. EMX2 regulates sizes and positioning of the primary sensory and motor areas in neocortex by direct specification of cortical progenitors. Neuron. 2004;43:359–372. doi: 10.1016/j.neuron.2004.07.016. - DOI - PubMed

Publication types

MeSH terms

LinkOut - more resources