Comparative Study
. 2006 Oct 24;16(20):2073-9.
doi: 10.1016/j.cub.2006.08.085. Epub 2006 Sep 14.

CRACM1 multimers form the ion-selective pore of the CRAC channel

Affiliations
Comparative Study

CRACM1 multimers form the ion-selective pore of the CRAC channel

Monika Vig et al. Curr Biol. .

Abstract

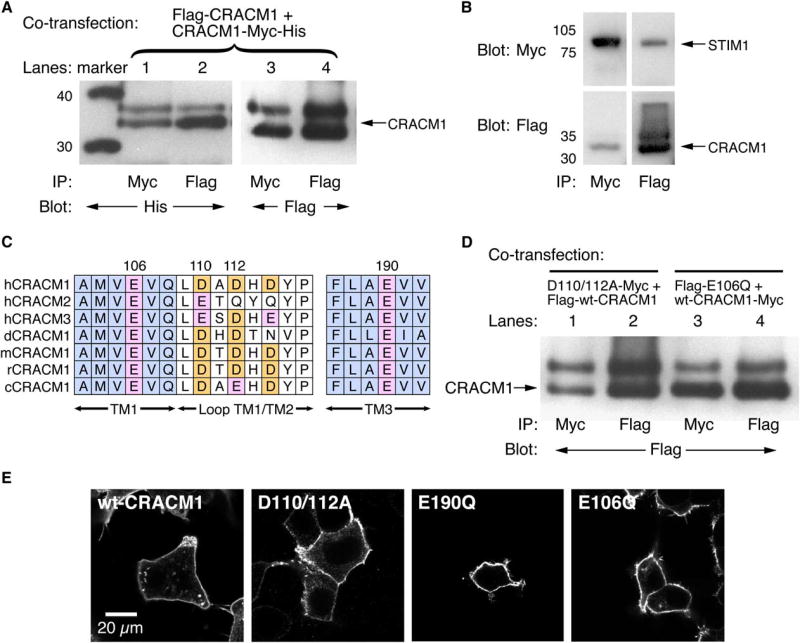
Receptor-mediated Ca(2+) release from the endoplasmic reticulum (ER) is often followed by Ca(2+) entry through Ca(2+)-release-activated Ca(2+) (CRAC) channels in the plasma membrane . RNAi screens have identified STIM1 as the putative ER Ca(2+) sensor and CRACM1 (Orai1; ) as the putative store-operated Ca(2+) channel. Overexpression of both proteins is required to reconstitute CRAC currents (I(CRAC); ). We show here that CRACM1 forms multimeric assemblies that bind STIM1 and that acidic residues in the transmembrane (TM) and extracellular domains of CRACM1 contribute to the ionic selectivity of the CRAC-channel pore. Replacement of the conserved glutamate in position 106 of the first TM domain of CRACM1 with glutamine (E106Q) acts as a dominant-negative protein, and substitution with aspartate (E106D) enhances Na(+), Ba(2+), and Sr(2+) permeation relative to Ca(2+). Mutating E190Q in TM3 also affects channel selectivity, suggesting that glutamate residues in both TM1 and TM3 face the lumen of the pore. Furthermore, mutating a putative Ca(2+) binding site in the first extracellular loop of CRACM1 (D110/112A) enhances monovalent cation permeation, suggesting that these residues too contribute to the coordination of Ca(2+) ions to the pore. Our data provide unequivocal evidence that CRACM1 multimers form the Ca(2+)-selective CRAC-channel pore.


Figures

Figure 1
Figure 1. CRACM1 Multimerizes with Itself to Form the CRAC Channel
(A) Coimmunoprecipitation (co-IP) of CRACM1 from HEK293 cells cotransfected with Flag-CRACM1 and CRACM1-Myc-His. Lane 2 shows that Flag-CRACM1 can co-IP CRACM1-Myc-His. Lane 3 shows the reverse co-IP, and lanes 1 and 4 show the control IPs. (B) Co-IP of Flag-CRACM1 and STIM1-Myc-His, cotransfected in HEK293 cells. Whole-cell lysates were immunoprecipitated with either myc antibody (first lane) or Flag antibody (second lane) and blotted with either myc antibody (upper panels) or Flag antibody (lower panels). The same experiment was done with the E106Q, D110/112A, and E190Q CRACM1 mutants. These mutations did not impair CRACM1-STIM1 coassociation (data not shown). (C) Sequence alignment of human CRACM1, CRACM2, and CRACM3 as well as CRACM1 from various species (Drosophila, mouse, rat, and chicken), highlighting the acidic residues (residue numbers pertain to the human sequence of CRACM1). (D) Co-IP of D110/112A-CRACM1 and E106Q-CRACM1 mutant with the wild-type CRACM1. Lane 1 shows that D110/112A-CRACM1-Myc-His can co-IP Flag-CRACM1, and lane 3 shows that CRACM1-Myc-His can co-IP Flag-E106Q-CRACM1. Lanes 2 and 4 show the controls. (E) Confocal images of HEK293 cells transfected with Flag-CRACM1, D110/112A-CRACM1-Myc-His, Flag-E190Q-CRACM1, and Flag-E106Q-CRACM1 and stained with myc or Flag antibodies, respectively, to show cellular localization of the mutants.
Figure 2
Figure 2. The E106 Residue Is Part of the Selectivity Filter of CRACM1
(A) Normalized average time course of IP3-induced (20 µM) CRAC currents measured in HEK293 cells co-overexpressing STIM1 and wild-type CRACM1 (black circles, n = 14) and E106Q mutation (red circles, n = 9). Currents of individual cells were measured at −80 mV, normalized by cell capacitance, averaged and plotted versus time (± SEM). Cytosolic calcium was clamped to near zero with 20 mM BAPTA. The bar indicates application of divalent-free (DVF) solution. (B) Average current-voltage (I/V) relationships of CRAC currents extracted from representative HEK293 cells shown in (A) at 120 s into the experiment. Data represent leak-subtracted currents evoked by 50 ms voltage ramps from −100 to +150 mV, normalized to cell capacitance (pF). Traces correspond to STIM1 + wild-type CRACM1 (wild-type, n = 12) or STIM1 + E106Q mutant (n = 6). (C) Normalized average time course of IP3-induced (20 µM) currents at −80 and +130 mV produced by the E106D mutant. Cells were exposed to nominally Ca2+-free external solution (black circles, n = 6) or Na+-free solution (red circles, n = 6) for the time indicated by the black bar. Currents were analyzed as in (A). (D) Average I/V traces of the E106D mutant extracted at 120 s (black trace, n = 6) and at the end of the application of Ca2+-free (blue trace, n = 6) or Na+-free (red trace, n = 6) solutions (same cells as in [C]). Data analysis was as in (B). (E) Normalized average time course of CRAC currents in HEK293 cells expressing STIM1 and wild-type CRACM1 (black circles, n = 9) or E106D mutant (red circles, n = 7). Analysis was as in (A). Cells were superfused with external solution containing 10 mM Ba2+ (and 0 Ca2+) at the time indicated by the black bar. Note that cells were superfused with Ba2+ in the absence of extracellular Na+ (replaced by TEA+) to avoid Na+ current contamination. (F) Average I/V data traces of currents extracted from representative HEK293 cells expressing the E106D mutant shown in (E), before (120 s, n = 4) and at the end (180 s, n = 4) of Ba2+ application. Analysis was as in (B). (G) Normalized average time course of IP3-induced (20 µM) currents at −80 and +130 mV produced by the E190Q mutant. Cells were exposed to nominally Ca2+-free external solution (black circles, n = 7) or Na+-free solution, where Ca2+ was substituted with Ba2+ (red circles, n = 8) for the time indicated by the bar. Currents were analyzed as in (A). (H) Average I/V traces of the E190Q mutant extracted at 120 s (black trace, n = 8) and at the end of the application of 10 mM Ba2+ (red trace, n = 8) or Ca2+-free solutions (blue trace, n = 7; same cells as in [G]). Data analysis was as in (B).
Figure 3
Figure 3. A Putative Extracellular Ca2+ Binding Site Contributes to Selectivity of CRACM1
(A) Normalized average time course of IP3-induced (20 µM) CRAC currents measured in HEK293 cells coexpressing STIM1 with either wild-type CRACM1 (black circles, n = 12) or the D110/112A mutant of CRACM1 (red circles, n =11). Currents of individual cells were measured at −80 mV and +130 mV, normalized by cell capacitance, averaged, and plotted versus time (± SEM). Cytosolic calcium was clamped to near zero with 20 mM BAPTA. The black bar indicates application of an external solution containing 10 mM Ca2+ with Na+ replaced by TEA+. (B) Average time course of IP3-induced (20 µM) currents produced by wild-type CRACM1 (black trace, same data as in Figure 2A) or D110/112A mutant. Currents were normalized to unity at 120 s (I/I120s). Cells expressing the D110/112A mutant were superfused with nominally Ca2+-free external solution in the presence (130 mM, n = 13) or absence of Na+ (TEA+ substitution, n = 5). Perfusion time is indicated by the black bar. Currents were analyzed as in (A). (C) Average I/V relationships of CRAC currents extracted from representative HEK293 cells shown in (A) and (B). Data represent average leak-subtracted currents evoked by 50 ms voltage ramps from −100 to +150 mV and normalized to cell capacitance (pF). Traces show wild-type CRACM1-expressing cells (black trace, n = 10; scaled by 1.7 to fit inward-current size of D110/112A mutant) at the end of application of a Na+-free solution containing 10 mM Ca2+ (180 s) and D110/112A mutants extracted before (at 120 s, blue trace, n = 11) or during application of nominally Ca2+-free solution containing normal Na+ (red trace, n = 11). (D) Normalized average time course (I/I120s) of IP3-induced (20 µM) currents produced by the D110/112A mutant in cells superfused with nominally Ca2+-free solution containing Na+ (red line, same data as in [B]), K+ (black circles, n = 12) or Cs+ (blue circles, n = 9). Application time is indicated by the black bar. Currents were analyzed as in (A). (E) Normalized average time course (I/I120s) of IP3-induced (20 µM) currents produced by wild-type CRACM1 (black circles, n = 8) or D110/112A mutant (red circles, n = 8). Cells were superfused with nominally divalent-free external solution supplemented with 10 µM Ca2+ as indicated by the black bar. Currents were analyzed as in (A). (F) Anomalous mole-fraction effect of wild-type CRACM1 (black circles, n = 5–14) or D110/112A mutant (red circles, n = 5–8). Current sizes measured at different Ca2+ concentrations were set in relation to current amplitudes obtained with 10 mM Ca2+, averaged and plotted against increasing extracellular Ca2+ concentrations. (G) Normalized average time course (I/I120s) of IP3-induced (20 µM) currents produced by wild-type CRACM1 in cells superfused with an external solution where 10 mM Ca2+ was equimolarly substituted with Ba2+ (black circles, n = 9) or Sr2+ (blue circles, n = 7) in the absence of Na+ (replaced by TEA+ to avoid Na+ current contamination). Currents were analyzed as in (A). (H) Normalized average time course (I/I120s) of IP3-induced (20 µM) currents produced by the D110/112A mutant in cells superfused with an external solution where 10 mM Ca2+ was substituted equimolarly with Ba2+ (black circles, n = 7) or Sr2+ (blue circles, n = 7) in the absence of Na+ (replaced by TEA+ to avoid Na+ current contamination). Currents were analyzed as in (A). (I) Permeation profile of wild-type CRACM1 (black, n = 5–12) or D110/112A mutant (red, n = 5–14). Currents at −80 mV were assessed at the end of an external application exchange (180 s), set in relation to currents before application (120 s), averaged, and plotted as rest current in percent (%). Data are sorted by application condition (10 mM Ca2+, 10 mM Ba2+, 10 mM Sr2+, 130 mM Na+, 130 mM K+, 130 mM Cs+). Note that monovalent conductances were assessed in nominally Ca2+-free solutions in the presence of standard Mg2+ concentrations (2 mM). Data represent the summary of (A) through (H).
Figure 4
Figure 4. Hypothetical Schematic of CRACM1 Assembly
The schematic summarizes our experimental observations, depicting three CRACM1 molecules within a multimeric assembly, whose exact unit number remains to be established. Because glutamate residues E106 in TM1 and E190 in TM3 affect ion selectivity, both likely face the lumen of the pore. This could be achieved by an N shaped geometry of the four TM domains so that TM domains 1 and 3 become neighbors, each providing slightly asymmetric orientations of glutamate pairs. Together, the multimers can form a ring of negative charges that provides a high-affinity binding site for one Ca2+ ion. The aspartate residues in the loop between TM1 and TM2 might create a second high-affinity Ca2+ binding site that, when occupied with Ca2+, could provide electrostatic potential for moving the glutamate-bound Ca2+ ion through the pore.

References

    1. Hoth M, Penner R. Depletion of intracellular calcium stores activates a calcium current in mast cells. Nature. 1992;355:353–356. - PubMed
    1. Hoth M, Penner R. Calcium release-activated calcium current in rat mast cells. J. Physiol. 1993;465:359–386. - PMC - PubMed
    1. Zweifach A, Lewis RS. Mitogen-regulated Ca2+ current of T lymphocytes is activated by depletion of intracellular Ca2+ stores. Proc. Natl. Acad. Sci. USA. 1993;90:6295–6299. - PMC - PubMed
    1. Parekh AB, Penner R. Store depletion and calcium influx. Physiol. Rev. 1997;77:901–930. - PubMed
    1. Parekh AB, Putney JW., Jr Store-operated calcium channels. Physiol. Rev. 2005;85:757–810. - PubMed

Publication types

MeSH terms