. 2006 Sep 19;16(18):1835-43.
doi: 10.1016/j.cub.2006.07.047.

Activity-independent prespecification of synaptic partners in the visual map of Drosophila

Affiliations

Activity-independent prespecification of synaptic partners in the visual map of Drosophila

P Robin Hiesinger et al. Curr Biol. .

Abstract

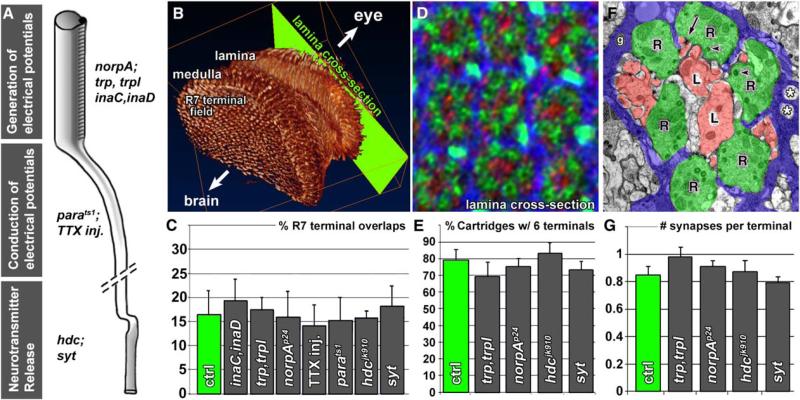
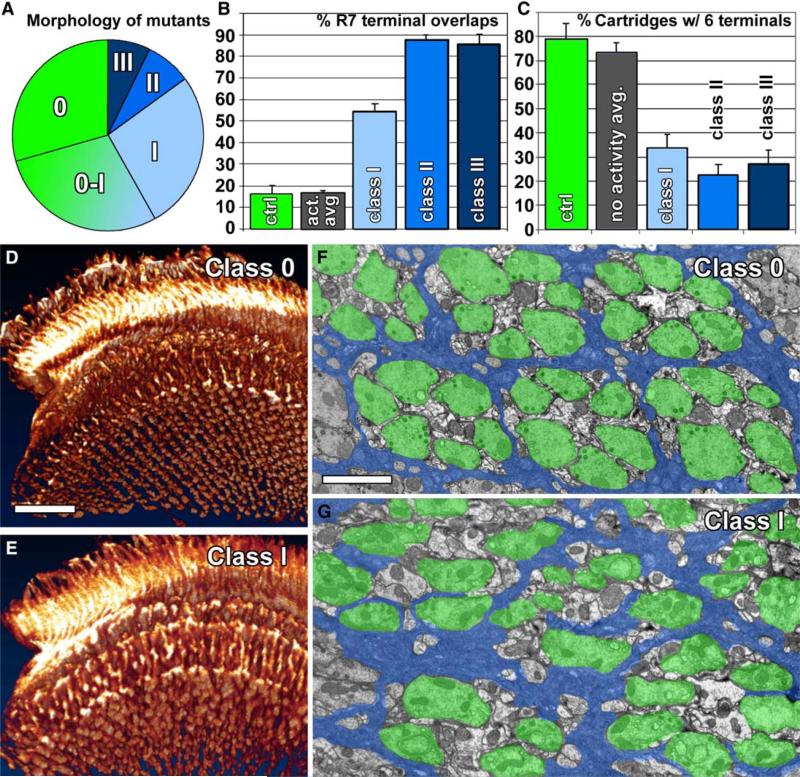
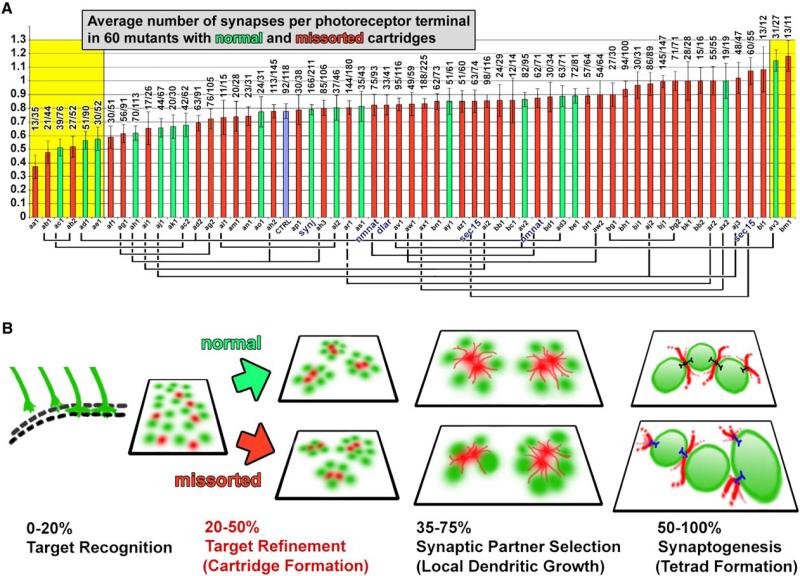
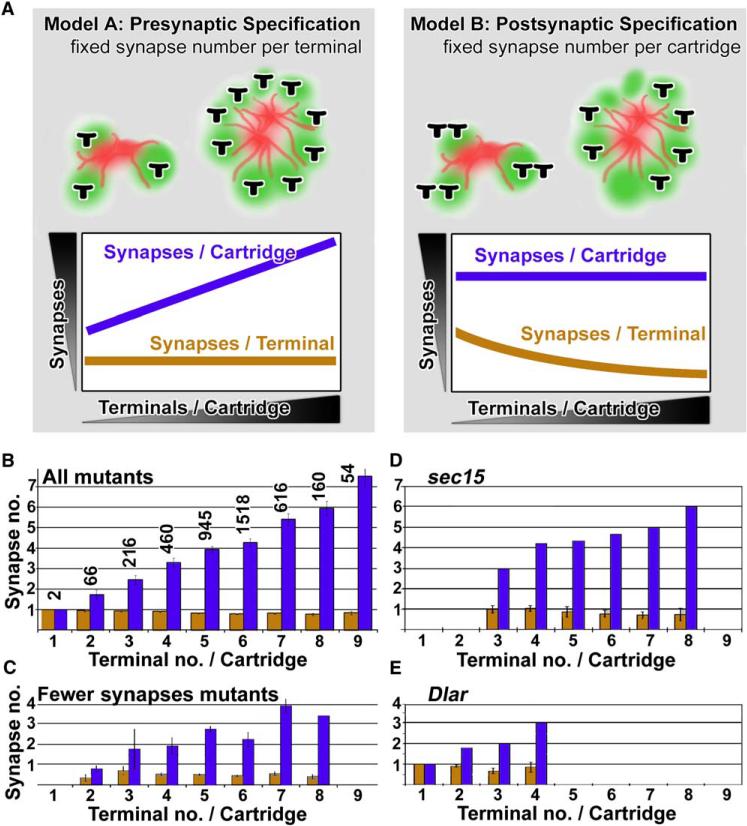
Specifying synaptic partners and regulating synaptic numbers are at least partly activity-dependent processes during visual map formation in all systems investigated to date . In Drosophila, six photoreceptors that view the same point in visual space have to be sorted into synaptic modules called cartridges in order to form a visuotopically correct map . Synapse numbers per photoreceptor terminal and cartridge are both precisely regulated . However, it is unknown whether an activity-dependent mechanism or a genetically encoded developmental program regulates synapse numbers. We performed a large-scale quantitative ultrastructural analysis of photoreceptor synapses in mutants affecting the generation of electrical potentials (norpA, trp;trpl), neurotransmitter release (hdc, syt), vesicle endocytosis (synj), the trafficking of specific guidance molecules during photoreceptor targeting (sec15), a specific guidance receptor required for visual map formation (Dlar), and 57 other novel synaptic mutants affecting 43 genes. Remarkably, in all these mutants, individual photoreceptors form the correct number of synapses per presynaptic terminal independently of cartridge composition. Hence, our data show that each photoreceptor forms a precise and constant number of afferent synapses independently of neuronal activity and partner accuracy. Our data suggest cell-autonomous control of synapse numbers as part of a developmental program of activity-independent steps that lead to a "hard-wired" visual map in the fly brain.


Figures

Figure 1
Figure 1. Reverse Genetics: Neuronal Activity Mutants Display No Defects in Photoreceptor Synapse Specification
(A) Selection of mutants that affect the generation or conduction of electrical potentials or neurotransmitter release. The tetrodotoxin (TTX) injection experiment is described in Supplemental Data. (B) 3D visualization of photoreceptor axon projections in the fly brain based on an antibody staining with the photoreceptor-specific antibody mAb 24B10 against Chaoptin [31]. Note the regular pattern of the R7 terminal field viewed from inside the brain. (C) Quantification of R7 terminal overlaps in all mutants including TTX injection flies reveals no fine-structural alterations (cf. Figure S1). (D and E) Quantification of the cartridge organization in lamina cross-sections (cf. [B]) reveals normal R1–R6 sorting in those mutants affecting the generation of electrical potentials or neurotransmitter release (cf. Figure S2). The antibody combination used in (D) labels R1–R6 (green), postsynaptic lamina-monopolar cells (red), and cartridge-enwrapping epithelial glia (blue) as previously described [20]. (F and G) Ultrastructural investigation reveals no alteration of the number of synapses formed in the same mutants (cf. Figure S4). Error bars are SEM.
Figure 2
Figure 2. Forward Genetics: Novel Mutants Isolated in a Screen for Defects in Synapse Formation and Function Display Several Classes of Photoreceptor Projection Defects
(A) Distribution of mutants in different morphological classes as defined by 3D visualizations of photoreceptor projection patterns (cf. Figure S6). Class 0-I are mutants with possible subtle patterning defects that were not further analyzed. (B) Quantification of R7 terminal fusions in 3D visualizations of the R7 terminal field reveal fusions between more than 50% of R7 terminals in class I mutants and more than 85% in class II and class III mutants. In contrast, the control as well as activity mutants display less than 20% R7 terminal fusions (cf. Figure 1C). (C) In a functional visual map, six R terminals are clearly recognizable in 70%–80% of all cartridges. In contrast to control and activity mutants, class I–III mutants exhibit the correct number of R terminals per cartridge in less than 35% of all cartridges. (D and E) Examples of class 0 and class I 3D visualization of photoreceptor projections and the R7 terminal field (cf. Figure 1B and Figure S6). (F and G) Examples of electron micrographs of lamina cross-sections showing the normal organization of cartridges in a class 0 mutant (F) and cartridge missorting in a class I mutant (G). Photoreceptors are indicated in green, cartridge-insulating epithelial glia in blue. Error bars are SEM. Scale bars represent 20 μm in (D) for (D) and (E); 2 μm in (F) for (F) and (G).
Figure 3
Figure 3. Cartridge Sorting Is Highly Susceptible to Genetic Disruption, but Missorting Does Not Affect the Average Number of Synapses
(A) Quantitative ultratructural investigation of the average number of synapses per photoreceptor terminal in 60 mutants with normal (green) and missorted (red) cartridges. Control is shown in blue. Alleles of the same complementation groups are marked by connecting lines under the x axis. Mutants with synapse numbers that are significantly different from control are on yellow background (p < 0.01, two-tailed pairwise Student's t test of every mutant with control). Numbers above graphs show the exact number of synapses/terminals. (B) Time series of developmental steps leading to the formation of visuotopically correct synapses. Neighboring cartridges are the synaptic units representing neighboring points in the visual world and form during the first half of brain development. The second half of brain development is characterized by synapse formation between synaptic partners that were prespecified during cartridge formation. A normal average number of synapses form in photoreceptor terminals independent of normal or missorted cartridge composition. Green, photoreceptor terminals; red, postsynaptic lamina monopolar cells. Error bars represent SEM.
Figure 4
Figure 4. Synapse Constancy in Photoreceptors Suggests a Cell-Autonomous Intrinsic Developmental Program that Regulates Synapse Numbers
(A) Two models of synapse specification: in the case of presynaptic specification (model A), the number of synapses is constant per photoreceptor terminal, and therefore cartridges with more terminals contain more synapses; in the case of postsynaptic (or cartridge) specification (model B), the number of synapses per photoreceptor is variable and depends on the number of R terminals present in the cartridge. (B) Synapse counts in a total of 4037 terminals in 783 cartridges with 1–9 terminals per cartridge reveals a fixed number of synapses per terminal independent of cartridge composition in agreement with model A. The number of synapses per terminal is shown in orange and is not significantly different for any cartridge composition (one-way ANOVA test; sample size is the number above each histogram bar [n = number of terminals]). (C) The same plot as in (B) for mutants with significantly fewer synapses than control (cf. Figure 3A). (D and E) Two mutants previously reported to display aberrant cartridge sorting and that we isolated in the screen: sec15 (D) and Dlar (E). Both are in agreement with model A, although in the case of Dlar the total number of terminals per cartridge is strongly reduced. For further plots of different electroretinogram mutant see Figure S9. Error bars are SEM.

References

    1. Shatz CJ. Emergence of order in visual system development. Proc. Natl. Acad. Sci. USA. 1996;93:602–608. - PMC - PubMed
    1. Cline H. Sperry and Hebb: oil and vinegar? Trends Neurosci. 2003;26:655–661. - PubMed
    1. Chandrasekaran AR, Plas DT, Gonzalez E, Crair MC. Evidence for an instructive role of retinal activity in retino-topic map refinement in the superior colliculus of the mouse. J. Neurosci. 2005;25:6929–6938. - PMC - PubMed
    1. Hua JY, Smear MC, Baier H, Smith SJ. Regulation of axon growth in vivo by activity-based competition. Nature. 2005;434:1022–1026. - PubMed
    1. Cang J, Renteria RC, Kaneko M, Liu X, Copenhagen DR, Stryker MP. Development of precise maps in visual cortex requires patterned spontaneous activity in the retina. Neuron. 2005;48:797–809. - PMC - PubMed

Publication types

MeSH terms