. 2006 Dec 1;91(11):4258-72.
doi: 10.1529/biophysj.106.091116. Epub 2006 Sep 15.

Ultra-high resolution imaging by fluorescence photoactivation localization microscopy

Affiliations

Ultra-high resolution imaging by fluorescence photoactivation localization microscopy

Samuel T Hess et al. Biophys J. .

Abstract

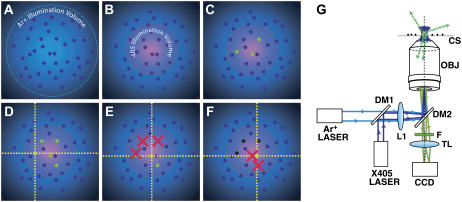
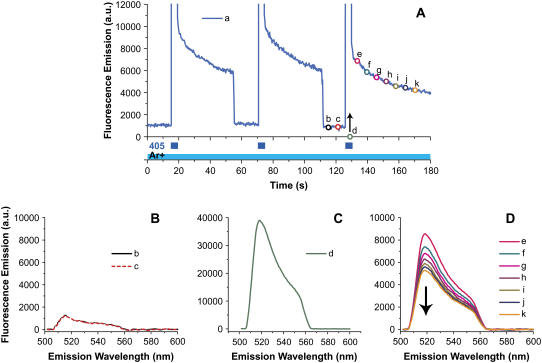
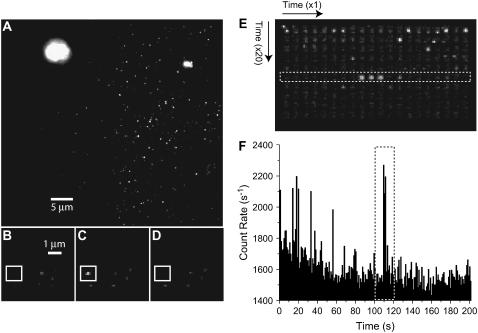
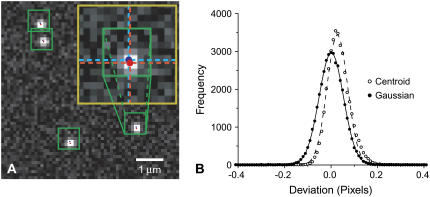
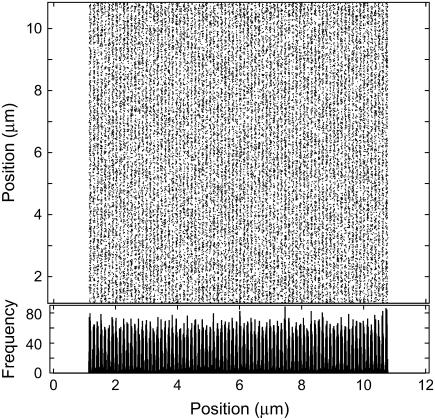
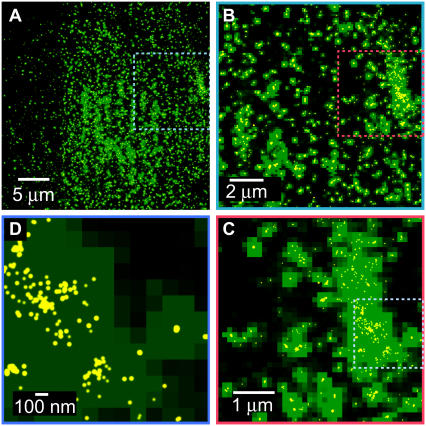
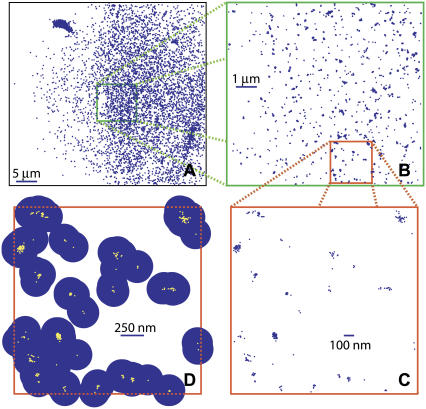
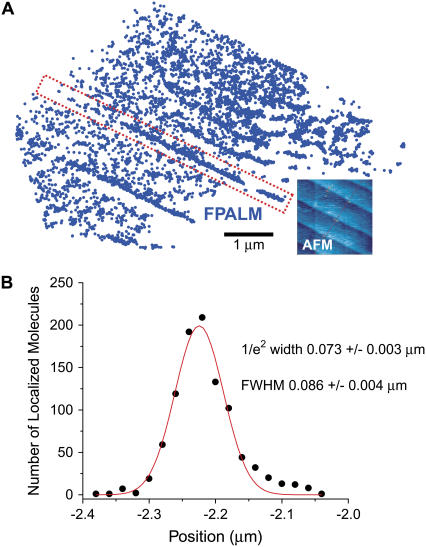
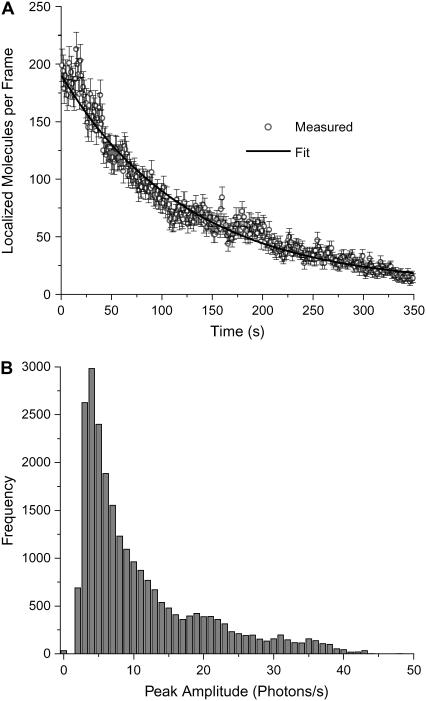
Biological structures span many orders of magnitude in size, but far-field visible light microscopy suffers from limited resolution. A new method for fluorescence imaging has been developed that can obtain spatial distributions of large numbers of fluorescent molecules on length scales shorter than the classical diffraction limit. Fluorescence photoactivation localization microscopy (FPALM) analyzes thousands of single fluorophores per acquisition, localizing small numbers of them at a time, at low excitation intensity. To control the number of visible fluorophores in the field of view and ensure that optically active molecules are separated by much more than the width of the point spread function, photoactivatable fluorescent molecules are used, in this case the photoactivatable green fluorescent protein (PA-GFP). For these photoactivatable molecules, the activation rate is controlled by the activation illumination intensity; nonfluorescent inactive molecules are activated by a high-frequency (405-nm) laser and are then fluorescent when excited at a lower frequency. The fluorescence is imaged by a CCD camera, and then the molecules are either reversibly inactivated or irreversibly photobleached to remove them from the field of view. The rate of photobleaching is controlled by the intensity of the laser used to excite the fluorescence, in this case an Ar+ ion laser. Because only a small number of molecules are visible at a given time, their positions can be determined precisely; with only approximately 100 detected photons per molecule, the localization precision can be as much as 10-fold better than the resolution, depending on background levels. Heterogeneities on length scales of the order of tens of nanometers are observed by FPALM of PA-GFP on glass. FPALM images are compared with images of the same molecules by widefield fluorescence. FPALM images of PA-GFP on a terraced sapphire crystal surface were compared with atomic force microscopy and show that the full width at half-maximum of features approximately 86 +/- 4 nm is significantly better than the expected diffraction-limited optical resolution. The number of fluorescent molecules and their brightness distribution have also been determined using FPALM. This new method suggests a means to address a significant number of biological questions that had previously been limited by microscope resolution.


Figures

FIGURE 1
FIGURE 1
Fluorescence photoactivation localization microscopy (FPALM). An area containing photoactivatable molecules (here, PA-GFP) is illuminated simultaneously with two frequencies of light, one for readout (here, an Ar+ ion laser, its spatial illumination profile shown in A), and a second one for activation (here, a 405-nm diode laser, its profile superimposed in B). Within the region illuminated by the activation beam, inactive PA-GFPs (small dark blue circles) are activated (C) (small green circles) and then localized (D). After some time, the active PA-GFPs (E) photobleach (red Xs) and (F) become irreversibly dark (black circles). Additional molecules are then activated, localized, and bleached until a sufficient number of molecules have been analyzed to construct an image. (G) The experimental geometry shows the 405-nm activation laser (X405), which is reflected by a dichroic (DM1) to make it collinear with the Ar+ readout laser. A lens (L1) in the back port of an inverted fluorescence microscope is used to focus the lasers, which are reflected upward by a second dichroic mirror (DM2), onto the back aperture of the objective lens (OBJ). The sample, supported by a coverslip (CS), emits fluorescence which is collected by the objective, transmitted through DM2, filtered (F), and focused by the tube lens (TL) to form an image on a camera (CCD).
FIGURE 2
FIGURE 2
Fluorescence emission before and after photoactivation of PA-GFP. (A) Fluorescence emission spectra were measured as a function of time as PA-GFP molecules immobilized on a glass coverslip were illuminated continuously with an Ar+ ion laser (time dependence shown by long, light blue bar along time axis), and intermittently with a 405-nm laser (short, dark blue bars just above the axis). The background-subtracted integrated area under the fluorescence spectrum is plotted as a function of time (blue curve a). Downward red arrows indicate movement of the sample to a new area that had not been illuminated previously. Under continuous illumination at 488 nm, the fluorescence intensity increased significantly during illumination with the 405-nm laser. The emission spectra at various times before activation (b and c), during (d), and after (ek) correspond to curves shown in BD. The downward black arrow in D indicates that the emission intensity was decreasing with time.
FIGURE 3
FIGURE 3
Imaging single molecules of PA-GFP. (A) Single frame (1-s acquisition) from a time series of images of PA-GFP molecules at low density on a glass coverslip illuminated continuously by an Ar+ ion laser and activated by brief pulses from a 405-nm diode laser. Fluorescence was detected from 510–560 nm. (BD) Three successive 1-s frames in the same series showing discrete on-off behavior expected for a single fluorophore. All images had the same constant offset subtracted and all pixels were multiplied by a second common constant for display purposes. (E) Collage of images from a longer time series of a 5 × 5-pixel region (∼0.6 μm × 0.6 μm) imaged at 0.998 frames/s for 200 s (images are arranged from left to right, in rows of ∼20 s each). (F) Count rate within the 5 × 5 region as a function of time shows discrete behavior. The dashed box in F highlights the time dependence of the count rate in the series of images in the white dashed box in E.
FIGURE 4
FIGURE 4
Single particle localization algorithm. Simulated images containing single particles were analyzed to compare the accuracy and precision of the centroid algorithm and Gaussian least-squares fit methods for particle localization. The simulated image (A) was processed to find pixels above a threshold and assign a nonoverlapping ROI for each one (minimum center-to-center ROI separation was 0.86 times the box full width). Centroid analysis was performed on ROIs with >20 pixels above a second threshold, and those coordinates (inset, dashed blue lines) were used as an initial guess for a Gaussian least-squares fit with the image using Eq. 11 (coordinates from the Gaussian best fit are shown in red). (B) Tabulation of the localization error for randomly positioned simulated molecules shows that the centroid algorithm has similar precision (curves shown are fits to a Gaussian distribution) but has a systematic bias. The Gaussian algorithm has less systematic bias and similar or better precision (particularly at low signal/noise ratio) (28) and was therefore used for subsequent analysis of the experimental images.
FIGURE 5
FIGURE 5
Simulated FPALM resolves a subdiffraction-scale structure. Simulated photoactivatable fluorescent molecules were distributed in periodic narrow vertical strips 60.5 nm wide, separated by 60.5-nm gaps. The molecules were activated stochastically in small numbers (∼50) per frame and simulated to emit photons, 1000 of which were detected. The simulated PSF was 200 nm wide (FWHM). Molecules were localized by the Gaussian algorithm described in Methods and in Fig. 4. A plot of 30,659 molecular positions determined by the algorithm demonstrates the ability of the technique to resolve structures smaller than the PSF. The histogram of particles observed within horizontally-spaced bins, each spanning a 10 nm range in x-coordinates only (shown directly below the plotted position), also reveals the subdiffraction periodicity of the simulated sample.
FIGURE 6
FIGURE 6
Measured FPALM images of PA-GFP on a glass coverslip. (AD) Measured positions of 48,746 localized molecules are plotted in yellow, weighted by the peak intensity at the center of the molecule, obtained from a Gaussian fit of the image using Eq. 11. The molecular positions from FPALM are plotted on top of the sum of all the widefield fluorescence images obtained during the acquisition (sum image shown in green) to illustrate the significantly greater resolution of FPALM compared to widefield fluorescence microscopy. The sequence from A to D progresses toward higher zoom, where the dotted box shows the region being expanded (e.g., the dotted red box in B shows the same region as all of C). In C and D, heterogeneity on length scales shorter than the classical diffraction limit is clearly visible.
FIGURE 7
FIGURE 7
Second representation of measured molecular positions obtained by FPALM. (AC) Blue dots indicate the location of a single PA-GFP molecule, determined by FPALM, of the same acquisition series shown in Fig. 6. (D) After zooming in >30-fold from A to C, the positions are replotted as yellow dots surrounded by a blue disk, approximating the lateral extent of the observation PSF, to emphasize the difficulty one would have in resolving these molecules simultaneously by standard widefield microscopy.
FIGURE 8
FIGURE 8
FPALM image of an R-cut single-crystal wafer of sapphire annealed at high temperature to produce atomic terraces, labeled with PA-GFP. (A) The positions of PA-GFP molecules localized over a period of 500 s are plotted (blue points) and compared with an atomic force microscope (AFM) image (inset) of the same sample (not necessarily the same area). Atomic step dislocations spaced laterally by 200–630 nm are visible by both techniques, because the PA-GFP has localized to those dislocations upon drying. Scale bar (1 μm) applies to both the FPALM and the AFM images. Note the gradient in particle density across the dislocations shown by FPALM. The red dotted box corresponds to the profile in B. (B) Analysis of the profile of a dislocation. The histogram of molecular positions (black points) as a function of distance perpendicular to the dislocation reveals the width of the feature as visualized by FPALM. Fitting the profile with a Gaussian (red line) yielded a 1/e2 half-width of 73 ± 3 nm, and an FWHM of 86 ± 4 nm.
FIGURE 9
FIGURE 9
Additional information, not available to ensemble fluorescence microscopy methods that image large numbers of molecules (≫100) simultaneously, is obtained by FPALM. (A) The number of molecules fluctuates and decays with time as FPALM frames are acquired. The number of fluorescent molecules within the observation volume in a widefield or confocal fluorescence microscope is difficult to determine without a calibration standard, but is obtained for every image in FPALM. A single exponential time constant (τ = 125 ± 3 s) described the decay of the number of molecules observed, consistent with depletion of a single reservoir of inactivated PA-GFP molecules. (B) The distribution of single-molecule fluorescence intensities is determined by FPALM and converted into the detected photon count rate at the center of the diffraction-limited image of the molecule. All amplitudes had a constant subtracted to account for background. Such information is useful in determining the degree of heterogeneity within a population of molecules and is typically difficult to obtain from measurements that sample large numbers of molecules simultaneously.

Similar articles

Cited by

References

    1. Alberts, B. 2002. Molecular Biology of the Cell. Garland Science, New York.
    1. Richards, B., and E. Wolf. 1959. Electromagnetic diffraction in optical systems. 2. Structure of the image field in an aplanatic system. Proc. R. Soc. Lond. A Math. Phys. Sci. 253:358–379.
    1. Born, M., and E. Wolf. 1997. Principles of Optics: Electromagnetic Theory of Propagation, Interference and Diffraction of Light. Cambridge University Press, Cambridge, UK.
    1. Hell, S. W., M. Schrader, and H. T. van der Voort. 1997. Far-field fluorescence microscopy with three-dimensional resolution in the 100-nm range. J. Microsc. 187:1–7. - PubMed
    1. Schrader, M., and S. W. Hell. 1998. Three-dimensional super-resolution with a 4Pi-confocal microscope using image restoration. J. Appl. Phys. 84:4033–4042.

Publication types

MeSH terms