

Differential detection of phospholipid fluidity, order, and spacing by fluorescence spectroscopy of bis-pyrene, prodan, nystatin, and merocyanine 540
- PMID: 16980369
- PMCID: PMC1635672
- DOI: 10.1529/biophysj.106.090860
Differential detection of phospholipid fluidity, order, and spacing by fluorescence spectroscopy of bis-pyrene, prodan, nystatin, and merocyanine 540
Abstract
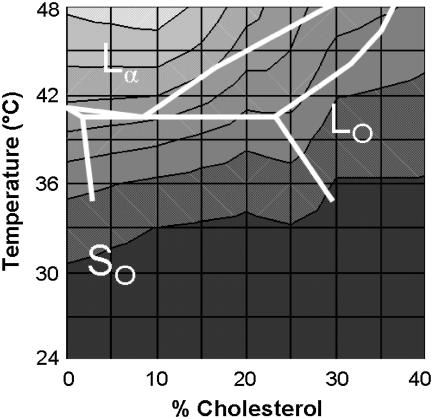
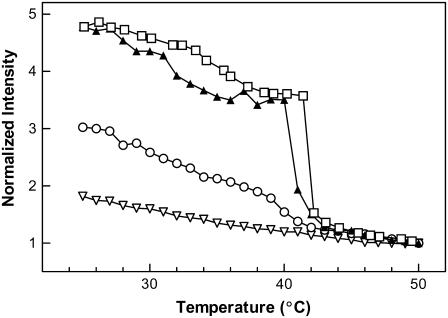
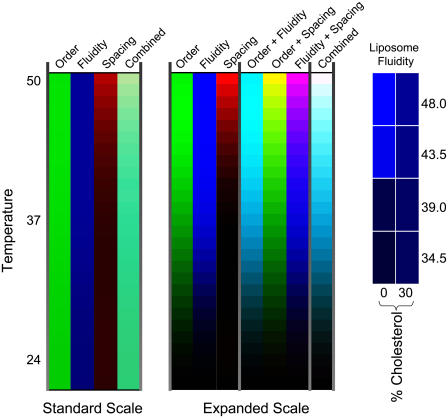
The properties of liquid-ordered, solid-ordered, and liquid-disordered phases were investigated by steady-state fluorescence spectroscopy in liposomes composed of mixtures of dipalmitoylphosphatidylcholine and cholesterol (0-40 mol %) as a function of temperature (24-51 degrees C). The fluorescent probes used (bis-pyrene, nystatin, prodan, and merocyanine) were chosen because they differ in the location they occupy in the membrane and in the types of properties they sense. Comparison of phase diagrams with contour plots of the fluorescence data suggested that bis-pyrene is sensitive primarily to lipid order. In contrast, nystatin fluorescence intensity responded to changes in lipid fluidity. The shape of the prodan emission spectrum detected both liquid-solid and order-disorder transitions in the phase diagram. Merocyanine's behavior was more complex. First, it was more sensitive than any of the other probes to the membrane pretransition that occurs in the absence of cholesterol. Second, regardless of whether emission intensity, anisotropy, or spectral shape was observed, the probe appeared to distinguish two types of liquid-ordered phases, one with tightly packed lipids and one in which the apparent spacing among lipids was increased. The prodan data supported these results by displaying modest versions of these two observations. Together, the results identify eight regions within the phase diagram of distinguishable combinations of these physical properties. As an example of how this combined analysis can be applied to biological membranes, human erythrocytes were treated similarly. Temperature variation at constant cholesterol content revealed three of the eight combinations identified in our analysis of liposomes.
Figures


Similar articles
-
Surface properties of cholesterol-containing membranes detected by Prodan fluorescence.Biochim Biophys Acta. 2001 Apr 2;1511(2):330-40. doi: 10.1016/s0005-2736(01)00286-3. Biochim Biophys Acta. 2001. PMID: 11286976
-
Use of laurdan fluorescence intensity and polarization to distinguish between changes in membrane fluidity and phospholipid order.Biochim Biophys Acta. 2002 Sep 20;1565(1):123-8. doi: 10.1016/s0005-2736(02)00514-x. Biochim Biophys Acta. 2002. PMID: 12225860
-
Preferential interactions of fluorescent probe Prodan with cholesterol.Biophys J. 1999 Feb;76(2):956-62. doi: 10.1016/S0006-3495(99)77259-0. Biophys J. 1999. PMID: 9916026 Free PMC article.
-
To see or not to see: lateral organization of biological membranes and fluorescence microscopy.Biochim Biophys Acta. 2006 Oct;1758(10):1541-56. doi: 10.1016/j.bbamem.2006.05.019. Epub 2006 Jun 2. Biochim Biophys Acta. 2006. PMID: 16854370 Review.
-
Fluorescence studies of lipid regular distribution in membranes.Chem Phys Lipids. 2002 Jun;116(1-2):153-75. doi: 10.1016/s0009-3084(02)00025-7. Chem Phys Lipids. 2002. PMID: 12093540 Review.
Cited by
-
Cholesterol-pyrene as a probe for cholesterol distribution on ordered and disordered membranes: Determination of spectral wavelengths.PLoS One. 2018 Aug 10;13(8):e0201373. doi: 10.1371/journal.pone.0201373. eCollection 2018. PLoS One. 2018. PMID: 30096186 Free PMC article.
-
Evaluation of Viburnum opulus L. Fruit Phenolics Cytoprotective Potential on Insulinoma MIN6 Cells Relevant for Diabetes Mellitus and Obesity.Antioxidants (Basel). 2020 May 16;9(5):433. doi: 10.3390/antiox9050433. Antioxidants (Basel). 2020. PMID: 32429334 Free PMC article.
-
Non steroidal anti-inflammatory drugs modulate the physicochemical properties of plasma membrane in experimental colorectal cancer: a fluorescence spectroscopic study.Mol Cell Biochem. 2011 Dec;358(1-2):161-71. doi: 10.1007/s11010-011-0931-1. Epub 2011 Jul 2. Mol Cell Biochem. 2011. PMID: 21725642
-
Phase Imaging of Phosphatidylcholine Bilayer Membranes by Prodan Fluorescence.Membranes (Basel). 2022 Dec 2;12(12):1219. doi: 10.3390/membranes12121219. Membranes (Basel). 2022. PMID: 36557126 Free PMC article.
-
Sphingolipids containing very long-chain fatty acids regulate Ypt7 function during the tethering stage of vacuole fusion.J Biol Chem. 2024 Nov;300(11):107808. doi: 10.1016/j.jbc.2024.107808. Epub 2024 Sep 21. J Biol Chem. 2024. PMID: 39307308 Free PMC article.
References
-
- Barenholz, Y. 2004. Sphingomyelin and cholesterol: from membrane biophysics and rafts to potential medical applications. Subcell. Biochem. 37:167–215. - PubMed
-
- Harris, F. M., K. B. Best, and J. D. Bell. 2002. Use of Laurdan fluorescence intensity and polarization to distinguish between changes in membrane fluidity and phospholipid order. Biochim. Biophys. Acta. 1565:123–128. - PubMed
-
- Galla, H. J., and E. Sackmann. 1974. Lateral diffusion in the hydrophobic region of membranes: use of pyrene excimers as optical probes. Biochim. Biophys. Acta. 339:103–115. - PubMed
Publication types
MeSH terms
Substances
Grants and funding
LinkOut - more resources
Full Text Sources
Research Materials
Miscellaneous
