

The number and spatial distribution of IP3 receptors underlying calcium puffs in Xenopus oocytes
- PMID: 16980372
- PMCID: PMC1635656
- DOI: 10.1529/biophysj.106.088880
The number and spatial distribution of IP3 receptors underlying calcium puffs in Xenopus oocytes
Abstract
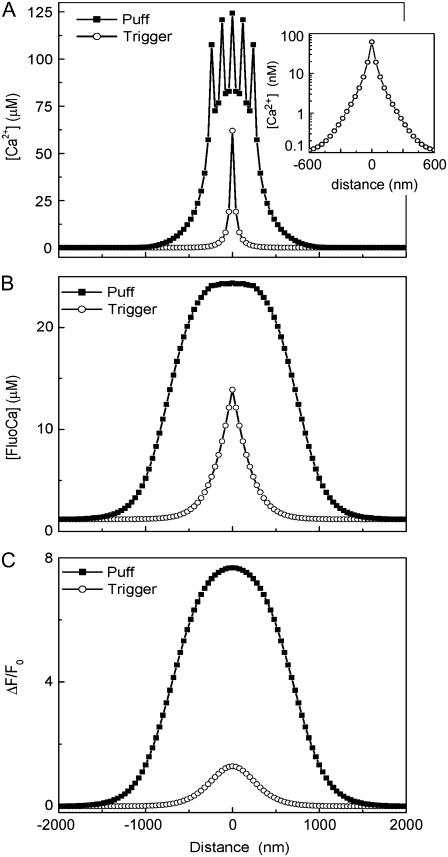
Calcium puffs are local Ca(2+) release events that arise from a cluster of inositol 1,4,5-trisphosphate receptor channels (IP(3)Rs) and serve as a basic "building block" from which global Ca(2+) waves are generated. Important questions remain as to the number of IP(3)Rs that open during a puff, their spatial distribution within a cluster, and how much Ca(2+) current flows through each channel. The recent discovery of "trigger" events-small Ca(2+) signals that immediately precede puffs and are interpreted to arise through opening of single IP(3)R channels-now provides a useful yardstick by which to calibrate the Ca(2+) flux underlying puffs. Here, we describe a deterministic numerical model to simulate puffs and trigger events. Based on confocal linescan imaging in Xenopus oocytes, we simulated Ca(2+) release in two sequential stages; representing the trigger by the opening of a single IP(3)R in the center of a cluster for 12 ms, followed by the concerted opening of some number of IP(3)Rs for 19 ms, representing the rising phase of the puff. The diffusion of Ca(2+) and Ca(2+)-bound indicator dye were modeled in a three-dimensional cytosolic volume in the presence of immobile and mobile Ca(2+) buffers, and were used to predict the observed fluorescence signal after blurring by the microscope point-spread function. Optimal correspondence with experimental measurements of puff spatial width and puff/trigger amplitude ratio was obtained assuming that puffs arise from the synchronous opening of 25-35 IP(3)Rs, each carrying a Ca(2+) current of approximately 0.4 pA, with the channels distributed through a cluster 300-800 nm in diameter.
Figures


Similar articles
-
'Trigger' events precede calcium puffs in Xenopus oocytes.Biophys J. 2006 Dec 1;91(11):4024-32. doi: 10.1529/biophysj.106.088872. Epub 2006 Sep 15. Biophys J. 2006. PMID: 16980363 Free PMC article.
-
Quantal puffs of intracellular Ca2+ evoked by inositol trisphosphate in Xenopus oocytes.J Physiol. 1995 Feb 1;482 ( Pt 3)(Pt 3):533-53. doi: 10.1113/jphysiol.1995.sp020538. J Physiol. 1995. PMID: 7738847 Free PMC article.
-
Factors determining the recruitment of inositol trisphosphate receptor channels during calcium puffs.Biophys J. 2013 Dec 3;105(11):2474-84. doi: 10.1016/j.bpj.2013.10.028. Biophys J. 2013. PMID: 24314078 Free PMC article.
-
Ca(2+) signalling by IP(3) receptors.Subcell Biochem. 2012;59:1-34. doi: 10.1007/978-94-007-3015-1_1. Subcell Biochem. 2012. PMID: 22374086 Review.
-
Dynamic regulation of IP3 receptor clustering and activity by IP3.Channels (Austin). 2009 Jul-Aug;3(4):226-32. doi: 10.4161/chan.3.4.9247. Epub 2009 Jul 12. Channels (Austin). 2009. PMID: 19617706 Review.
Cited by
-
Recording single-channel activity of inositol trisphosphate receptors in intact cells with a microscope, not a patch clamp.J Gen Physiol. 2010 Aug;136(2):119-27. doi: 10.1085/jgp.200910390. J Gen Physiol. 2010. PMID: 20660654 Free PMC article.
-
Intra-cluster percolation of calcium signals.PLoS One. 2010 Feb 18;5(2):e8997. doi: 10.1371/journal.pone.0008997. PLoS One. 2010. PMID: 20174630 Free PMC article.
-
Multi-dimensional resolution of elementary Ca2+ signals by simultaneous multi-focal imaging.Cell Calcium. 2008 Apr;43(4):367-74. doi: 10.1016/j.ceca.2007.07.002. Epub 2007 Aug 22. Cell Calcium. 2008. PMID: 17716727 Free PMC article.
-
Localization and socialization: experimental insights into the functional architecture of IP3 receptors.Chaos. 2009 Sep;19(3):037103. doi: 10.1063/1.3147425. Chaos. 2009. PMID: 19792028 Free PMC article. Review.
-
A kinetic model of single and clustered IP3 receptors in the absence of Ca2+ feedback.Biophys J. 2007 Aug 15;93(4):1151-62. doi: 10.1529/biophysj.107.108795. Epub 2007 May 25. Biophys J. 2007. PMID: 17526578 Free PMC article.
References
-
- Berridge, M. J., M. D. Bootman, and P. Lipp. 1998. Calcium—a life and death signal. Nature. 395:645–648. - PubMed
-
- Parker, I., and Y. Yao. 1991. Regenerative release of calcium from functionally discrete subcellular stores by inositol trisphosphate. Proc. Biol. Sci. 246:269–274. - PubMed
-
- Berridge, M. J. 1997. Elementary and global aspects of calcium signalling. J. Exp. Biol. 200:315–319. - PubMed
Publication types
MeSH terms
Substances
Grants and funding
LinkOut - more resources
Full Text Sources
Miscellaneous
