. 2006 Nov;174(3):1259-71.
doi: 10.1534/genetics.106.064709. Epub 2006 Sep 15.

Genetic evidence for phospholipid-mediated regulation of the Rab GDP-dissociation inhibitor in fission yeast

Affiliations

Genetic evidence for phospholipid-mediated regulation of the Rab GDP-dissociation inhibitor in fission yeast

Yan Ma et al. Genetics. 2006 Nov.

Abstract

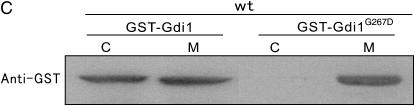
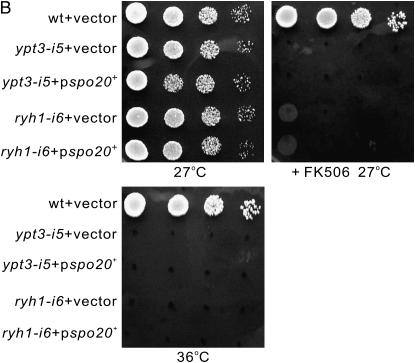
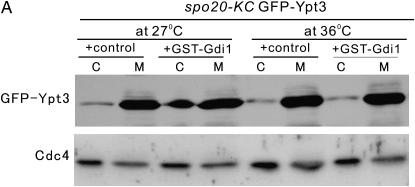
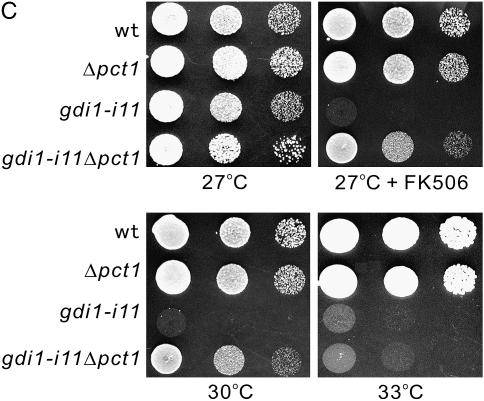
We have previously identified mutant alleles of genes encoding two Rab proteins, Ypt3 and Ryh1, through a genetic screen using the immunosuppressant drug FK506 in fission yeast. In the same screen, we isolated gdi1-i11, a mutant allele of the essential gdi1+ gene encoding Rab GDP-dissociation inhibitor. In gdi1-i11, a conserved Gly267 was substituted by Asp. The Gdi1G267D protein failed to extract Rabs from membrane and Rabs were depleted from the cytosolic fraction in the gdi1-i11 mutant cells. Consistently, the Gdi1G267D protein was found mostly in the membrane fraction, whereas wild-type Gdi1 was found in both the cytosolic and the membrane fraction. Notably, overexpression of spo20+, encoding a phosphatidylcholine/phosphatidylinositol transfer protein, rescued gdi1-i11 mutation, but not ypt3-i5 or ryh1-i6. The gdi1-i11 and spo20-KC104 mutations are synthetically lethal, and the wild-type Gdi1 failed to extract Rabs from the membrane in the spo20-KC104 mutant. The phosphatidylinositol-transfer activity of Spo20 is dispensable for the suppression of the gdi1-i11 mutation, suggesting that the phosphatidylcholine-transfer activity is important for the suppression. Furthermore, knockout of the pct1+ gene encoding a choline phosphate cytidyltransferase rescued the gdi1-i11 mutation. Together, our findings suggest that Spo20 modulates Gdi1 function via regulation of phospholipid metabolism of the membranes.


Figures

F<sc>igure</sc> 1.—
Figure 1.—
Mutation in the its11+/gdi1+ gene causes immunosuppressant- and temperature-sensitive phenotypes. (A) The immunosuppressant and temperature sensitivities of the its11-1/gdi1-i11 mutant cells. Cells transformed with the multicopy vector pDB248 or the vector containing the gdi1+ gene were streaked onto each plate containing YPD and YPD plus 0.5 μg/ml FK506, and then incubated for 4 days at 27° and for 3 days at 36°, respectively. (B) Alignment of protein sequences of S. pombe Gdi1 with related proteins from human and S. cerevisiae. Sequence alignment was performed using the Clustal W program. Asterisks indicate identical amino acids. Arrow indicates the mutation site in the glycine267 of Gdi1, which, when mutated to aspartic acid, resulted in immunosuppressant- and temperature-sensitive function in Gdi1. (C) Schematic of the SCRs and where the gdi1-i11 mutation resides. Star indicates the mutation site.
F<sc>igure</sc> 2.—
Figure 2.—
Rabs failed to distribute in the cytosolic fraction in the gdi1-i11 mutant cells. Wild-type cells and gdi1-i11 mutant cells transformed with each of the indicated GFP-Rab were grown in EMM containing 4 μm thiamine for 12 hr. Cells were lysed in the absence of detergent and the resulting extracts were centrifuged at 100,000 × g for 70 min to generate membrane and cytosolic fractions. Equal aliquots were treated with antibodies to GFP. Endogenous Cdc4 was used as a loading control and was immunoblotted using anti-Cdc4 antibodies. C, cytosolic fraction; M, membrane fraction.
F<sc>igure</sc> 3.—
Figure 3.—
The characterization of the Gdi1G267D protein. (A) Coprecipitation of Ypt3 with GST-Gdi1G267D. GFP-Ypt3-integrated cells expressing pREP1-GST (control), pREP1-GST-Gdi1, or pREP1-GST-Gdi1 G267D were grown in EMM medium in the absence of thiamine for 20 hr. The proteins were extracted in the presence of detergent. GST-Gdi1, GST-Gdi1G267D, and GST were precipitated by glutathione beads, washed extensively, subjected to SDS–PAGE, and immunoblotted using anti-GFP or anti-GST antibodies. (B) Distribution of Ypt3 and Ryh1 between membrane and cytosolic fractions after wild-type Gdi1 and Gdi1G267D overexpression. GFP-Ypt3- and GFP-Ryh1-integrated cells harboring pREP1-GST-Gdi1 or pREP1-GST-Gdi1G267D were grown in EMM containing 4 μm thiamine for 12 hr. The cells were collected and the fractionation experiment was performed as described in Figure 2. Equal aliquots were treated with anti-GFP antibodies to detect Ypt3 and Ryh1 and with anti-GST antibodies to detect Gdi1. C, cytosolic fraction; M, membrane fraction. (C) Distribution of overexpressed wild-type Gdi1 or Gdi1G267D in cytosolic and membrane fractions in wild-type cells. Wild-type cells harboring pREP1-GST-Gdi1 or pREP1-GST-Gdi1G267D were grown in EMM containing 4 μm thiamine for 20 hr. The cells were collected and the fractionation experiment was performed as described in Figure 2. (D) Quantifications of the distribution of Rabs and GDIs (coexpressed with GFP-Ypt3) between cytosolic and membrane fractions. The panels in Figure 3B were quantitated using ImageJ software.
F<sc>igure</sc> 4.—
Figure 4.—
Defects in membrane traffic in the gdi1-i11 mutant cells. (A) Defective secretion of SPL-GFP to the growth medium in gdi1-i11 mutants. Wild-type cells and gdi1-i11 mutant cells expressing SPL-GFP were cultured at 27° or 33° for 4 hr or at 27° with or without the addition of FK506 for 8 hr. Proteins were separated by SDS–PAGE and analyzed by Western blotting using anti-GFP antibody. Extra: the trichloroacetic-acid precipitate of supernatant of 5 × 10⁶ cells; Intra: cell extract of 1 × 10⁶ cells. (B) Time-course analysis of LY internalization. Wild-type (wt) and gdi1-i11 mutant cells were incubated in the medium containing Lucifer yellow (5 mg/ml) and the washed cells were viewed under a fluorescence microscope (LY) and a differential interference contrast microscope. Bar, 10 μm. (C) Electron microscopic analysis of gdi1-i11 mutant cells grown at 33° for 4 hr. (D) The boxed regions (a, b, and c) in C are enlarged. (a) Putative post-Golgi vesicles around Golgi structures. Bar, 1 μm. (b) An abnormal membranous structure of a Berkeley body. Bar, 0.5 μm. (c) Fragmented vacuoles in gdi1-i11 mutant. Bar, 1 μm. (d) Abnormal electron-dense membranous structures closely connected to the Golgi structure. Bar, 1 μm.
F<sc>igure</sc> 5.—
Figure 5.—
The isolation of spo20+ as a specific dosage-dependent suppressor of the gdi1-i11 mutant cells. (A and B) Overexpression of Spo20-suppressed phenotypes of the gdi1-i11 mutant, but not those of the ypt3-i5 or ryh1-i6 mutant. The indicated cells transformed with the control vector or spo20+ were spotted onto each plate as indicated. Cells were spotted in serial 10-fold dilutions starting with OD660 = 0.3 of log-phase cells (5 μl). (C) Overexpression of Spo20, but not of other Sec14 family members, suppressed the phenotypes of the gdi1-i11 mutant. The gdi1-i11 mutants expressing control vector, SPBC23B6.04, SPBC3H8.02, SPBC365.01, SPBC589.09, and spo20+ were spotted onto the indicated plates and then incubated for 4 days at 27° and 30°, respectively. (D) The gdi1-i11 mutant is synthetically lethal with the spo20-KC104 mutant. Tetrad analysis used progeny derived from crossing KP1893 (h+ his2 leu1-32 gdi1-i11) with KP2678 (h leu1-32 ura4-D18 spo20-KC104). Colonies grown on YPD at 27 ° were replica plated onto various plates as indicated. Colonies that failed to grow on YPD at 33° and at 36° were predicted to be gdi1-i11 (gdi1), and those that grew on YPD at 33° and grew very slowly at 36° were predicted to be spo20-KC104 (spo20). The rest of the colonies that grew at either of the temperatures were predicted to be wild-type cells (wt). Spores that failed to grow were predicted to be gdi1-i11spo20-KC104 double mutants (D).
F<sc>igure</sc> 6.—
Figure 6.—
Spo20 suppressed the defective phenotypes associated with gdi1-i11 mutants. (A) Spo20 partially suppressed the defective localization of GFP-Syb1 in the gdi1-i11 mutant cells. The gdi1-i11 mutant cells expressing chromosome-borne GFP-Syb1 were transformed with the control vector, gdi1+, or spo20+ and were examined under the fluorescence microscope. (B) Spo20 suppressed the defective vacuole fusion in the gdi1-i11 mutant cells. The gdi1-i11 mutant cells transformed with each of the indicated plasmids were grown in YPD medium at 27°. Cells were harvested, labeled with FM4-64 fluorescent dye for 60 min (see materials and methods), and then resuspended in water and examined by fluorescence microscopy. Photographs were taken after 60 min. Bar, 10 μm. (C) Spo20 suppressed the defective cytokinesis in the gdi1-i11 mutant cells. The gdi1-i11 mutant cells expressing control vector, spo20+, or gdi1+ were shifted to the restrictive temperature (33°) for 6 hr, or FK506 was added for 6 hr and incubated at 27° and then stained with Calcofluor to visualize cell wall and septum. Bar, 10 μm. (D) Percentage of cells forming a division septum at each time point in the gdi1-i11 mutant cells expressing control vector, spo20+, or gdi1+ after the shift to 33° (left) or the addition of FK506 at 27° (right). Values are the average of three independent experiments with 500 cells counted for each time point. Standard deviations between experiments were <10%.
F<sc>igure</sc> 7.—
Figure 7.—
Spo20 modulates Gdi1 function via regulation of phospholipid metabolism. (A) Spo20 affects extraction of Rab from membrane. The spo20-KC104 mutant cells integrated with GFP-Ypt3 harboring control vector or pREP1-GST-Gdi1 were cultured in EMM containing 4 μm thiamine for 8 hr, and then each culture was divided into two portions. One portion was maintained at 27°, while the remaining portion was shifted to 36° for 4 hr. The cells were collected and the fractionation experiment was performed as described in Figure 2. Endogenous Cdc4 was used as a loading control and was immunoblotted using anti-Cdc4 antiserum. C, cytosolic fraction; M, membrane fraction. (B) phosphatidylinositol-transfer activity of Spo20 is dispensable for the suppression of the gdi1-i11 mutant phenotype. The gdi1-i11 mutants expressing the control vector, Spo20K60AK234A, Spo20K60A, Spo20K234A, or wild-type Spo20 were spotted onto the plates as indicated and then incubated for 4 days at 27° and 30°, respectively. (C) The growth defect of the gdi1-i11 mutant was partially rescued by pct1 deletion. Wild-type, gdi1-i11 mutant, Δpct1, and gdi1-i11Δpct1 cells were spotted onto each plate as indicated and then incubated for 4 days at 27° or 30° and for 3 days at 33°, respectively.

Similar articles

Cited by

References

    1. Beach, D., M. Piper and P. Nurse, 1982. Construction of a Schizosaccharomyces pombe gene bank in a yeast bacterial shuttle vector and its use to isolate genes by complementation. Mol. Gen. Genet. 187: 326–329. - PubMed
    1. Bone, N., J. B. Millar, T. Toda and J. Armstrong, 1998. Regulated vacuole fusion and fission in Schizosaccharomyces pombe: an osmotic response dependent on MAP kinases. Curr. Biol. 8: 135–144. - PubMed
    1. Cheng, H., R. Sugiura, W. Wu, M. Fujita, Y. Lu et al., 2002. Role of the Rab GTP-binding protein Ypt3 in the fission yeast exocytic pathway and its connection to calcineurin function. Mol. Biol. Cell 13: 2963–2976. - PMC - PubMed
    1. D'Adamo, P., A. Menegon, N. C. Lo, M. Grasso, M. Gulisano et al., 1998. Mutations in GDI1 are responsible for X-linked non-specific mental retardation. Nat. Genet. 19: 134–139. - PubMed
    1. D'Adamo, P., H. Welzl, S. Papadimitriou, D. B. Raffaele, C. Tiveron et al., 2002. Deletion of the mental retardation gene Gdi1 impairs associative memory and alters social behavior in mice. Hum. Mol. Genet. 11: 2567–2580. - PubMed

Publication types

MeSH terms