Comparative Study
. 2006 Nov;174(3):1229-36.
doi: 10.1534/genetics.106.061481. Epub 2006 Sep 15.

Large-scale gene expression differences across brain regions and inbred strains correlate with a behavioral phenotype

Affiliations
Comparative Study

Large-scale gene expression differences across brain regions and inbred strains correlate with a behavioral phenotype

Jessica J Nadler et al. Genetics. 2006 Nov.

Abstract

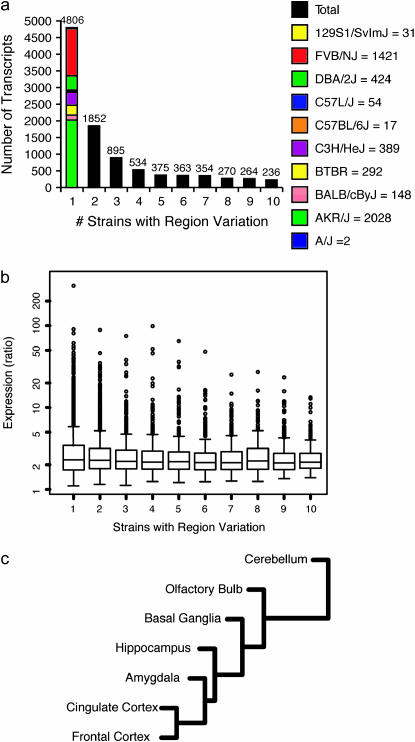
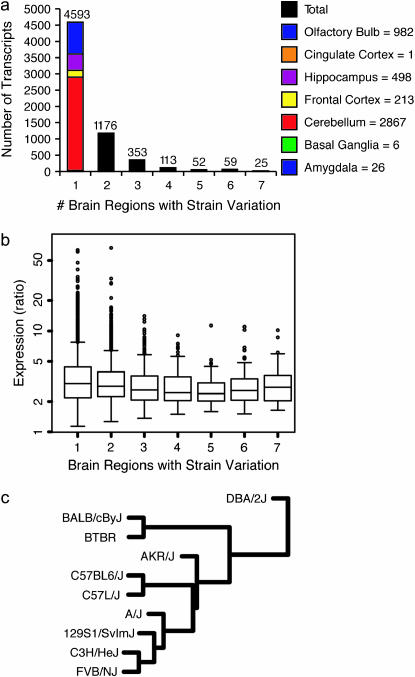
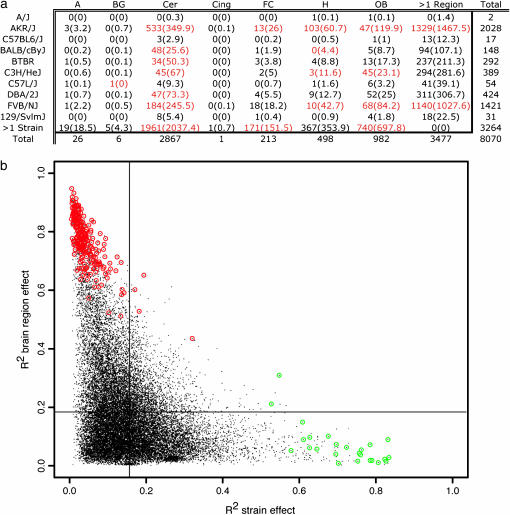
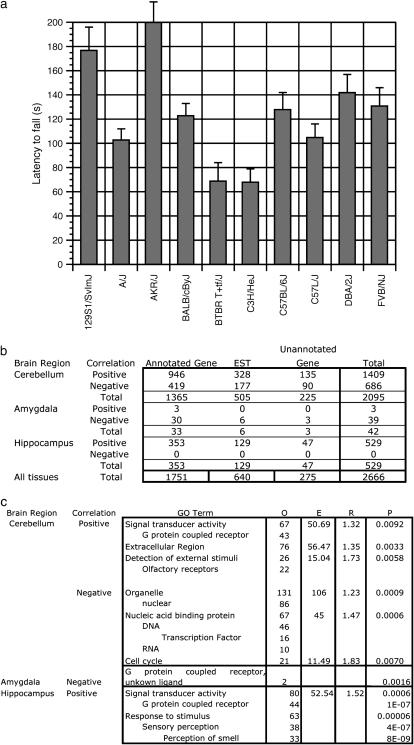
Behaviors are often highly heritable, polygenic traits. To investigate molecular mediators of behavior, we analyzed gene expression patterns across seven brain regions (amygdala, basal ganglia, cerebellum, frontal cortex, hippocampus, cingulate cortex, and olfactory bulb) of 10 different inbred mouse strains (129S1/SvImJ, A/J, AKR/J, BALB/cByJ, BTBR T+ tf/J, C3H/HeJ, C57BL/6J, C57L/J, DBA/2J, and FVB/NJ). Extensive variation was observed across both strain and brain region. These data provide potential transcriptional intermediates linking polygenic variation to differences in behavior. For example, mice from different strains had variable performance on the rotarod task, which correlated with the expression of >2000 transcripts in the cerebellum. Correlation with this task was also found in the amygdala and hippocampus, but not in other regions examined, indicating the potential complexity of motor coordination. Thus we can begin to identify expression profiles contributing to behavioral phenotypes through variation in gene expression.


Figures

F<sc>igure</sc> 1.—
Figure 1.—
Gene expression varies with brain region. (a) Number of genes with variable expression across brain regions in one or more strains. Column 1, genes with variable expression across brain regions in a single strain, is divided by which strain has variation (supplemental data 2 at http://www.genetics.org/supplemental/). (b) Range of expression level as a ratio of maximum expression to minimum expression. Columns correspond to a. (c) Cluster of brain regions using strain-averaged gene expression profiles.
F<sc>igure</sc> 2.—
Figure 2.—
Gene expression is quantifiably different between strains. (a) Number of genes with variable expression across strains in one or more brain regions. Column 1, genes with variable expression across strains in a single region, is divided by which region has variation (supplemental data 5 at http://www.genetics.org/supplemental/). (b) Range of expression level as a ratio of maximum expression to minimum expression. Columns correspond to a. (c) Cluster of strains using region-averaged gene expression profiles.
F<sc>igure</sc> 3.—
Figure 3.—
Gene expression is influenced by strain and region. (a) The number of genes whose variation is attributed to a particular brain region-by-strain identity. This is the intersection of genes in the first column of Figures 1a and 2a. Cells in red indicate significant departure from that expected. A, amygdala. BG, basal ganglia. Cer, cerebellum. Cing, cingulate cortex. FC, frontal cortex. H, hippocampus. OB, olfactory bulb. Observed (expected) values are shown. (b) Each point represents a single gene with variable expression across strain or region. The x-axis indicates the proportion of expression variation due to strain, the y-axis indicates variation due to brain region. Lines indicate the mean R2-value for each axis. Genes from the last bar of Figure 1a are circled in red. Genes from the last bar of Figure 2a are circled in green.
F<sc>igure</sc> 4.—
Figure 4.—
Gene expression as a function of motor coordination. (a) Performance on rotarod as measured by latency to fall in seconds. (b) Number of genes correlated to rotarod performance. Positive and negative correlations divided by known genes, ESTs, and unknown genes as listed on the Agilent gene list are shown. (c) Overrepresented GO term categories in the 500 most highly correlated sequences for both positive and negative correlations. O, observed. E, expected. R, enrichment. P, P-value.

References

    1. Bast, T., and J. Feldon, 2003. Hippocampal modulation of sensorimotor processes. Prog. Neurobiol. 70: 319–345. - PubMed
    1. Benjamini, Y., and Y. Hochberg, 1995. Controlling the false discovery rate / a practical and powerful approach to multiple testing. J. R. Stat. Soc. 57: 289–300.
    1. Bogue, M. A., and S. C. Grubb, 2004. The Mouse Phenome Project. Genetica 122: 71–74. - PubMed
    1. Carninci, P., T. Kasukawa, S. Katayama, J. Gough, M. C. Frith et al., 2005. The transcriptional landscape of the mammalian genome. Science 309: 1559–1563. - PubMed
    1. Corbetta, S., S. Gualdoni, C. Albertinazzi, S. Paris, L. Croci et al., 2005. Generation and characterization of Rac3 knockout mice. Mol. Cell. Biol. 25: 5763–5776. - PMC - PubMed

Publication types

MeSH terms