. 2006 Nov;72(11):7286-93.
doi: 10.1128/AEM.01398-06. Epub 2006 Sep 15.

Toward a more robust assessment of intraspecies diversity, using fewer genetic markers

Affiliations

Toward a more robust assessment of intraspecies diversity, using fewer genetic markers

Konstantinos T Konstantinidis et al. Appl Environ Microbiol. 2006 Nov.

Abstract

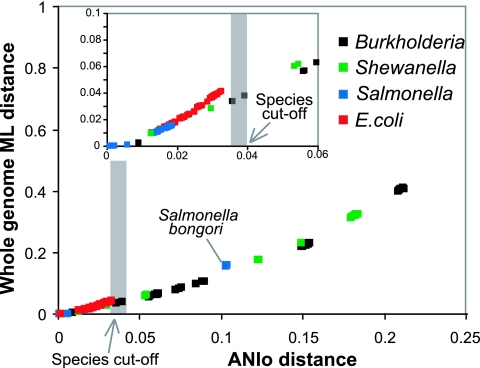
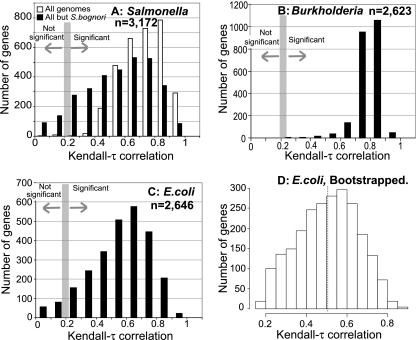
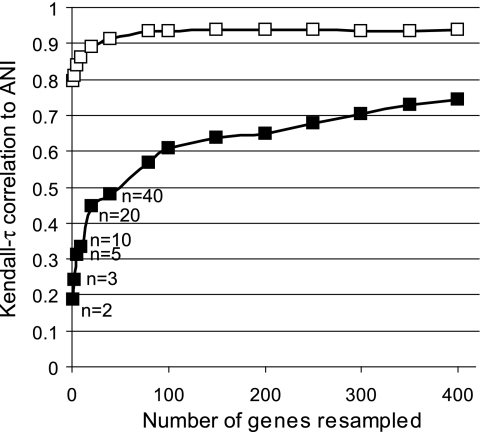
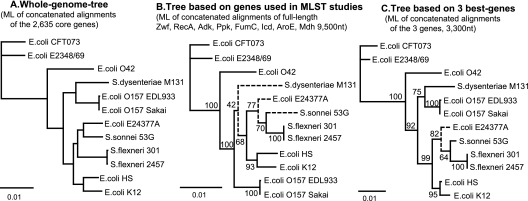
Phylogenetic sequence analysis of single or multiple genes has dominated the study and census of the genetic diversity among closely related bacteria. It remains unclear, however, how the results based on a few genes in the genome correlate with whole-genome-based relatedness and what genes (if any) best reflect whole-genome-level relatedness and hence should be preferentially used to economize on cost and to improve accuracy. We show here that phylogenies of closely related organisms based on the average nucleotide identity (ANI) of their shared genes correspond accurately to phylogenies based on state-of-the-art analysis of their whole-genome sequences. We use ANI to evaluate the phylogenetic robustness of every gene in the genome and show that almost all core genes, regardless of their functions and positions in the genome, offer robust phylogenetic reconstruction among strains that show 80 to 95% ANI (16S rRNA identity, >98.5%). Lack of elapsed time and, to a lesser extent, horizontal transfer and recombination make the selection of genes more critical for applications that target the intraspecies level, i.e., strains that show >95% ANI according to current standards. A much more accurate phylogeny for the Escherichia coli group was obtained based on just three best-performing genes according to our analysis compared to the concatenated alignment of eight genes that are commonly employed for phylogenetic purposes in this group. Our results are reproducible within the Salmonella, Burkholderia, and Shewanella groups and therefore are expected to have general applicability for microevolution studies, including metagenomic surveys.


Figures

FIG. 1.
FIG. 1.
Genetic diversity within each of the four bacterial groups studied, based on the ML and ANIo measurements. Each square represents a pair of genomes from one group, colored according to the group to which the genomes belong (see legend). Whole-genome ML distances between two genomes in the pair (y axis) are plotted against their ANIo distances (x axis). The gray area corresponds to the current species cutoff for bacteria.
FIG. 2.
FIG. 2.
Performance of individual genes against the whole-genome average. The individual-gene-based distance matrix for all genome pairs in a group was compared to the ANIo matrix for the same genome pairs by using the nonparametric Kendall τ correlation test. Graphs show the distribution of the Kendall τ values for all core genes within a group (1, perfect correlation; 0, no correlation). The area that corresponds to a significant correlation (P < 0.05) is also designated. The E. coli (A), Salmonella (B), and Burkholderia (C) groups are shown. Panel D shows the distribution of the Kendall τ values for the genes in the E. coli group, which were significant, as determined by the bootstrap approach (see Materials and Methods for details). n, number of genes.
FIG. 3.
FIG. 3.
Upper and lower confidence levels for the Kendall τ correlation coefficients for a given number of genes. The upper (open squares) and the lower (solid squares) 95% confidence levels for the Kendall τ correlation coefficients between the averages for the ML distances for a given number of genes (x axis) and the ANIo distances are shown for the E. coli group. See Materials and Methods for details on the calculation of the confidence intervals.
FIG. 4.
FIG. 4.
Improved phylogenetic reconstruction in an MLST-like application, using only three of the genes in the genome. Three maximum-likelihood trees are shown, one based on the concatenated alignment of all 2,635 core genes for the E. coli group (A), one based on the concatenated alignment of 8 genes frequently used in MLST studies for the E. coli group (B), and one based on the concatenated alignment of 3 of the best-performing genes according to our analysis (C). Dashed branches designate the major differences between the trees in panels B and C and the whole-genome tree (A). nt, nucleotides.
FIG. 5.
FIG. 5.
Functional annotations of the genes with significant correlation with ANIo values. The number of genes with significant correlation with ANIo (Kendall τ correlation > 0.221, P < 0.05) (y axes) is plotted against the total number of genes in a COG functional category (x axes). Using a higher cutoff for Kendall τ correlation (e.g., >0.35) does not change the results shown. The letters on the graphs correspond to the COG individual functional categories according to the category designations on the COG website (http://www.ncbi.nlm.nih.gov/COG/).
FIG. 6.
FIG. 6.
Spatial distribution of the Kendall τ values for individual genes in the E. coli genome. The inner circle represents the G + C% skew analysis of the E. coli strain O157 (Sakai) genome, while the outer circle represents the distribution of the Kendall τ values for every core gene (n = 2,635), centered around the average Kendall τ value, which is ∼0.46. Kendall τ values are derived from the correlation analysis between the individual-gene-based ML distances and the ANIo distances for all pairs of E. coli genomes (see Materials and Methods for details). Blue bars represent genes with Kendall τ values that are smaller than and red bars genes with Kendall τ values that are higher than the average Kendall τ value, while the height of the bar is proportional to the difference from the average Kendall τ value. The figure was plotted using the GenomeViz software (7). (A) The individual values were plotted along the mean position of each gene, and a local fitting algorithm was used to further reveal the major patterns in the data. (B) The presence of significant autocorrelation, as represented by filled circles, was determined for each distance class by a Moran I correlogram by bootstrap analysis (see Materials and Methods for more detail).

Similar articles

Cited by

References

    1. Adiri, R. S., U. Gophna, and E. Z. Ron. 2003. Multilocus sequence typing (MLST) of Escherichia coli O78 strains. FEMS Microbiol. Lett. 222:199-203. - PubMed
    1. Altschul, S. F., T. L. Madden, A. A. Schaffer, J. Zhang, Z. Zhang, W. Miller, and D. J. Lipman. 1997. Gapped BLAST and PSI-BLAST: a new generation of protein database search programs. Nucleic Acids Res. 25:3389-3402. - PMC - PubMed
    1. Ciccarelli, F. D., T. Doerks, C. von Mering, C. J. Creevey, B. Snel, and P. Bork. 2006. Toward automatic reconstruction of a highly resolved tree of life. Science 311:1283-1287. - PubMed
    1. Feil, E. J. 2004. Small change: keeping pace with microevolution. Nat. Rev. Microbiol. 2:483-495. - PubMed
    1. Feil, E. J., B. C. Li, D. M. Aanensen, W. P. Hanage, and B. G. Spratt. 2004. eBURST: inferring patterns of evolutionary descent among clusters of related bacterial genotypes from multilocus sequence typing data. J. Bacteriol. 186:1518-1530. - PMC - PubMed

Publication types