. 2006 Oct;188(19):6953-65.
doi: 10.1128/JB.00681-06.

Dual role of the PhoP approximately P response regulator: Bacillus amyloliquefaciens FZB45 phytase gene transcription is directed by positive and negative interactions with the phyC promoter

Affiliations

Dual role of the PhoP approximately P response regulator: Bacillus amyloliquefaciens FZB45 phytase gene transcription is directed by positive and negative interactions with the phyC promoter

Oliwia Makarewicz et al. J Bacteriol. 2006 Oct.

Abstract

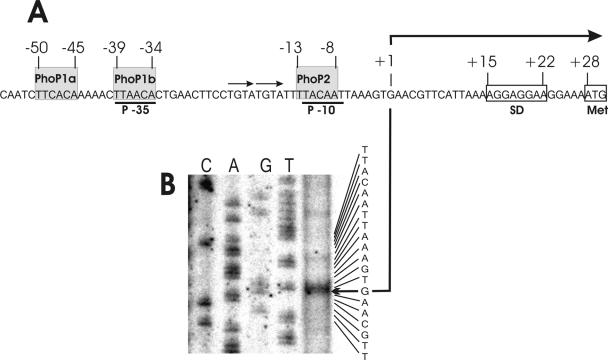
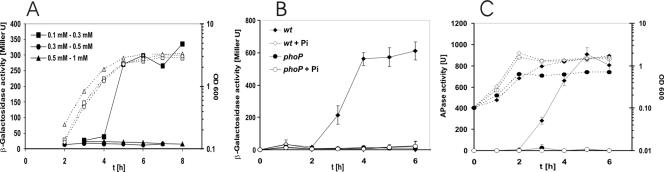
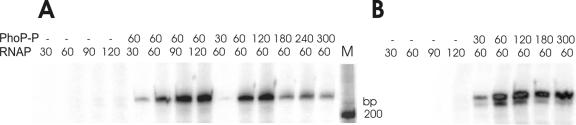
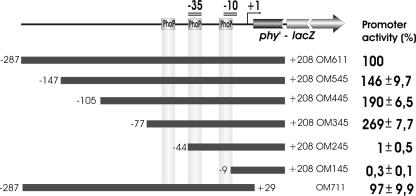
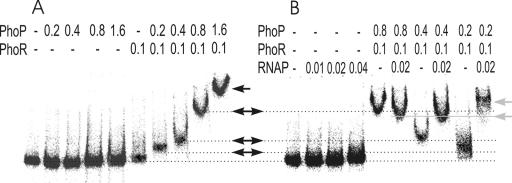
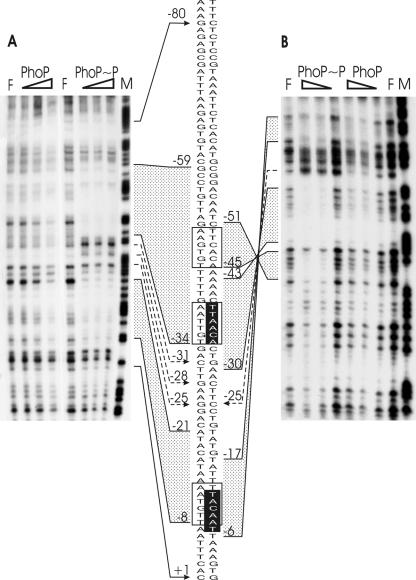
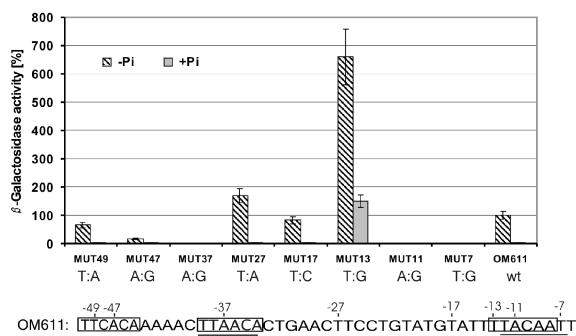
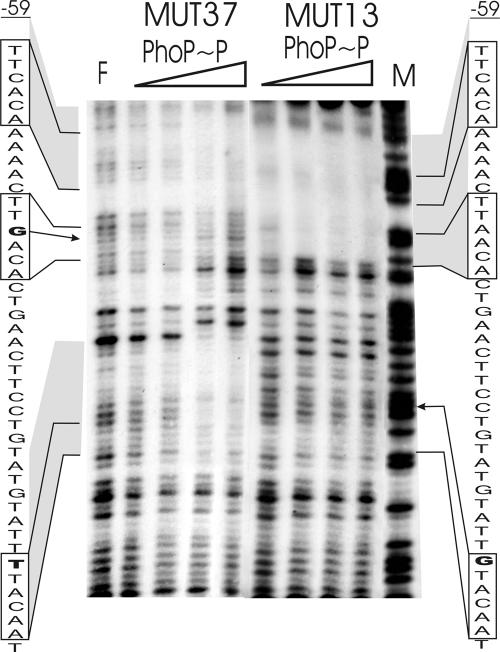
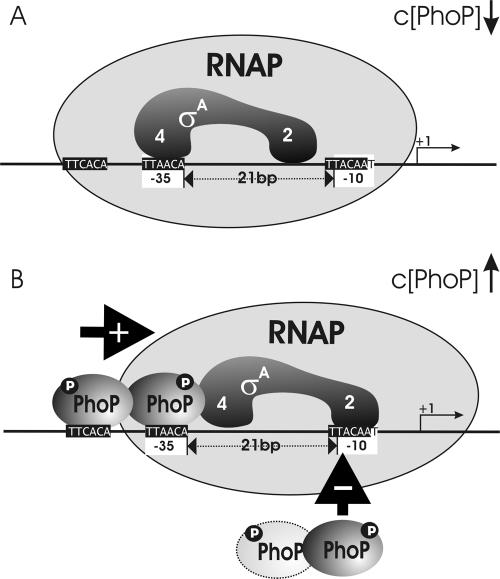
Several Bacillus strains secrete phytase, an enzyme catalyzing dephosphorylation of myo-inositol hexakisphosphate (phytate). We identified the phyC (phytase) gene from environmental Bacillus amyloliquefaciens FZB45 as a member of the phosphate starvation-inducible PhoPR regulon. In vivo and in vitro assays revealed that PhoP approximately P is essential for phyC transcription. The transcriptional start site was identified downstream of a sigmaA-like promoter region located 27 bp upstream of the probable translation ATG start codon. Inspection of the phyC promoter sequence revealed an unusual structure. The -35 and -10 regions are separated by a window of 21 bp. A pair of tandemly repeated PhoP TT(T/A/C)ACA binding boxes was located within and upstream of the -35 consensus promoter region. A single PhoP box was found within the -10 consensus promoter region. DNase I footprinting experiments performed with isolated PhoP confirmed that PhoP approximately P binds at two sites overlapping with the phyC -35 and -10 consensus promoter region. While binding of dimeric PhoP approximately P at -35 is essential for activation of the phyC promoter, binding of PhoP approximately P at -10 suppresses promoter activity. A sixfold enhancement of phyC gene expression was registered after T:G substitution of nucleotide -13 (mutant MUT13), which eliminates PhoP binding at the single PhoP box without impairing the -10 consensus sequence. Moreover, MUT13 also expressed phyC during phosphate-replete growth, suggesting that the repressing effect due to binding of PhoP approximately P at -10 was abolished. A model is presented in which transcription initiation of phyC is positively and negatively affected by the actual concentration of the PhoP approximately P response regulator.


Figures

FIG. 1.
FIG. 1.
Promoter structure of the FZB45 phyC gene. (A) Architecture of the phyC promoter of FZB45. Gray shading identifies the putative PhoP binding boxes. Transcriptional start site is indicated by a bent arrow. Consensus sequences (−35 and −10) are underlined. (B) Mapping of the 5′ end of the phyC transcript by primer extension. The CAGT sequence ladder corresponding to the nucleotide sequence of the noncoding strand is indicated at the right. The initiation of transcription (G) is marked by a bent arrow.
FIG. 2.
FIG. 2.
Induction of APase and β-galactosidase in phyC-lacZ fusion strains. (A) Expression of β-galactosidase by strain OM611, which contains an FZB45 phyC-lacZ fusion, under three different phosphate concentrations (filled symbols). Growth of the cultures is indicated by open symbols linked by dashed lines. The symbols are given as an average range of phosphate concentrations according to measurements performed during cultivation. (B) phyC promoter activity in strain OM611 (wild type) (diamonds) or strain OM621 (phoP) (circles). Both strains were grown in LPM (solid symbols) and HPM containing 10 mM phosphate (open symbols). (C) Growth and APase activity of OM611 (diamonds) or OM622 (phoP) (circles) in HPM (open symbols) and LPM (solid symbols). APase activity was measured as a control for the PhoP-negative phenotype. The experiments were repeated at least three times, with similar results.
FIG. 3.
FIG. 3.
In vitro transcription analysis of phyC. Transcription was carried out for 20 min at 37°C with purified RNAP in various amounts and a 10 nM concentration of a 511-bp phyC template of the wild-type (A) or MUT13 (B) promoter. PhoP (1.25 μM) was phosphorylated by 0.3 μM PhoR in binding buffer in the presence of 5 mM ATP for 20 min as described previously and was then added to the transcription reaction. The final concentrations (nM) of RNAP and PhoP-P are given at the top. M, molecular standard.
FIG. 4.
FIG. 4.
Deletion analysis of the FZB45 phyC promoter. Top: fusion product consisting of the phyC promoter linked at +208 with the lacZ gene. Position of the PhoP boxes, of the −35 and −10 promoter sequences, and of the start point of transcription (+1) are indicated. The filled boxes represent the various lengths of the phyC promoter fragments used in this assay. The 5′ and 3′ ends of each fragment were labeled relative to the transcription start site, +1. The strains carrying the various truncated phyC promoters were grown in LPM, and the promoter activity was determined every hour. The highest activity of the reporter was obtained after 6 h and was used for calculating the relative promoter activity. The reporter activity of the full-length promoter corresponds to 100%; the activities of the other promoters are calculated as the average percentages of expression relative to that of the full-length promoter. The average mean deviation (±) was calculated from three independent experiments.
FIG. 5.
FIG. 5.
Gel retardation analysis of the FZB45 phyC promoter by PhoP, PhoP∼P, and RNAP. The promoter DNA fragment was γ-32P labeled at the 5′ end of the reverse strand. Each lane contained a 15 nM concentration of the labeled probe and 5 mM ATP. The proteins were purified as described in the text. Phosphorylation of PhoP was performed in the presence of PhoR231 and ATP. After the binding reaction with the DNA fragment, the samples were loaded on a native polyacrylamide gel in order to separate the free DNA and the DNA-protein complex. The concentrations (μM) of the proteins added to the lanes are indicated on top. The arrows indicate the different complexes.
FIG. 6.
FIG. 6.
DNase I footprinting analysis of the FZB45 phyC promoter bound by the PhoP or PhoP∼P protein. A promoter fragment amplified by the F2for and F2rev primers was used to prepare the probe. Various amounts of PhoP incubated with or without PhoR231 (0.4 μM) in the presence of 5 mM ATP were mixed with the 150-bp phyC promoter probe, and DNase I footprinting experiments were performed with both the end-labeled noncoding (A) and coding (B) strands. F, control without protein; M, A+G-sequencing reaction. The concentrations of PhoP used in each reaction were 0.5 μM, 1.0 μM, and 1.5 μM. The gray areas represent the PhoP- and PhoP∼P-protected regions at the coding (right) and the noncoding (left) strands, and the hypersensitive sites are marked with dashed arrows. The transcription start +1 site is indicated by an arrow. The corresponding sequence section is shown in the center, and the positions of interest are numbered. The PhoP recognition sites are framed, and the −10 and −35 regions are shown in white letters on a black background.
FIG. 7.
FIG. 7.
Base substitution analysis within the promoter region upstream of phyC. The following substitutions were made: −49 (T→A), −47 (A→G), −37 (A→G), −27 (T→A), −17 (T→C), −13 (T→G), −11 (A→G), and −7 (T→G). The β-galactosidase activities of the clones were measured after 6 h of growth under high- and low-phosphate conditions. The reporter activity of the wild-type (wt) promoter corresponds to 100%; the activities of the other promoters were calculated as average percentages of expression relative to that of the wt promoter. The average mean deviation (±) was calculated from three independent experiments. Bottom: sequence of PphyC. Substitutions are numbered, and the −35 and −10 regions are indicated. The putative PhoP-binding sites are contrasted by a gray background.
FIG. 8.
FIG. 8.
DNase I footprinting analysis of mutagenized FZB45 phyC promoter fragments bound with the PhoP∼P protein. The promoter fragment amplified by F1for and F3rev primers was used to prepare a 364-bp probe. Various amounts of PhoP incubated with PhoR231 (0.4 μM) in the presence of 5 mM ATP were mixed with the phyC promoter probe, and DNase I footprinting experiments were performed with the end-labeled noncoding strand. F = without protein; M = A+G-sequencing reaction lane. The concentrations of PhoP used in each reaction were 0.1 μM, 0.25 μM, 0.5 μM, and 1.0 μM. The gray areas represent PhoP∼P-protected regions, the boxes indicate the PhoP recognition sites, and the letters in bold mark the substituted bases.
FIG. 9.
FIG. 9.
Model of the interactions of PhoP and RNAP on the phyC promoter of B. amyloliquefaciens FZB45. In the absence of PhoP∼P, EσA RNAP binds preferentially to one of the two possible binding sites at −35 and −10 due to their improper spacing. In the presence of phosphorylated PhoP, the potential binding sites become occupied by the response regulator: the tandem repeat PhoP boxes adjacent to −35 with higher efficiency than the single one at −10. Upon binding of the dimeric response regulator PhoP∼P to a region adjacent to −35, binding of RNAP at −10 is facilitated by protein-protein interactions with the upstream bound PhoP∼P. Formation of open complex and transcription initiation will start. A rising concentration of PhoP∼P, causing competition between PhoP∼P and RNAP at −10, eventually decreases transcription efficiency. The promoter consensus sites are labeled with white, the PhoP binding sites with black boxes. The putative binding sites at subdomains EσA2 and EσA4 are indicated.

Similar articles

Cited by

References

    1. Abdel-Fattah, W. R., Y. Chen, A. Eldakak, and F. M. Hulett. 2005. Bacillus subtilis phosphorylated PhoP: direct activation of the EσA- and repression of the EσE-responsive phoB-PS+V promoters during Pho response. J. Bacteriol. 187:5166-5178. - PMC - PubMed
    1. Anagnostopoulos, C., and J. Spizizen. 1961. Requirements for transformation in Bacillus subtilis. J. Bacteriol. 81:741-746. - PMC - PubMed
    1. Antelmann, H., C. Scharf, and M. Hecker. 2000. Phosphate starvation-inducible proteins of Bacillus subtilis: proteomics and transcriptional analysis. J. Bacteriol. 182:4478-4490. - PMC - PubMed
    1. Antoniewski, C., B. Savelli, and P. Stragier. 1990. The spoIIJ gene, which regulates early developmental steps in Bacillus subtilis, belongs to a class of environmentally responsive genes. J. Bacteriol. 172:86-93. - PMC - PubMed
    1. Atlung, T., and L. Brönsted. 1994. Role of the transcriptional activator AppY in regulation of the cyx appA operon of Escherichia coli by anaerobiosis, phosphate starvation, and growth phase. J. Bacteriol. 176:5414-5422. - PMC - PubMed

Publication types

MeSH terms

LinkOut - more resources