

Beryllium-induced TNF-alpha production is transcription-dependent in chronic beryllium disease
- PMID: 16980557
- PMCID: PMC2176111
- DOI: 10.1165/rcmb.2006-0021TR
Beryllium-induced TNF-alpha production is transcription-dependent in chronic beryllium disease
Abstract
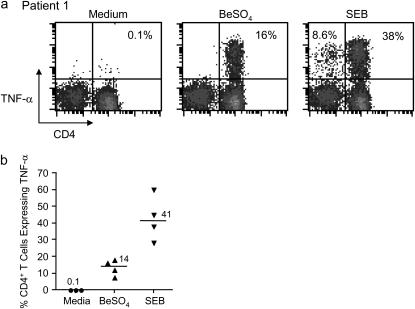
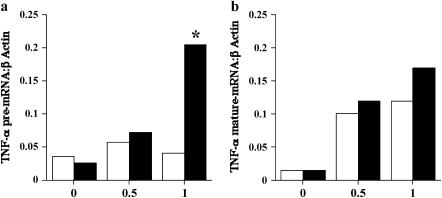
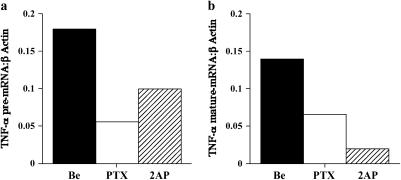
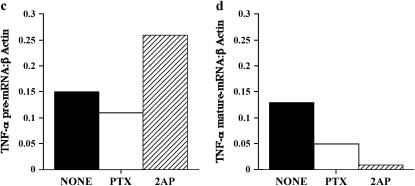
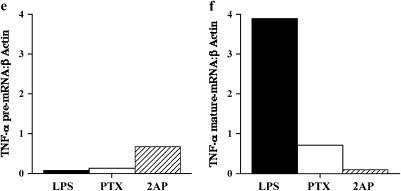
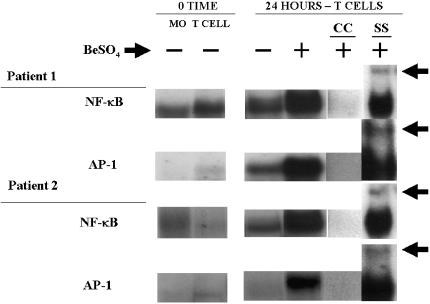
Beryllium (Be)-antigen presentation to Be-specific CD4(+) T cells from the lungs of patients with chronic beryllium disease (CBD) results in T cell proliferation and TNF-alpha secretion. We tested the hypothesis that Be-induced, CBD bronchoalveolar lavage (BAL) T cell, transcription-dependent, TNF-alpha secretion was accompanied by specific transcription factor upregulation. After 6 h of Be stimulation, CBD BAL cells produced a median of 883 pg/ml TNF-alpha (range, 608-1,275 pg/ml) versus 198 pg/ml (range, 116-245 pg/ml) by unstimulated cells. After 12 h CBD BAL cells produced a median of 2,963 pg/ml (range, 99-9,424 pg/ml) TNF-alpha versus 55 pg/ml (range, 0-454) by unstimulated cells. Using real-time RT-PCR, Be-stimulated TNF-alpha production at 6 h was preceded by a 5-fold increase in TNF-alpha pre-mRNA copy number:beta-actin copy number (Be median ratio 0.21; unstimulated median ratio 0.04). The median ratio of mature TNF-alpha mRNA:beta-actin mRNA was upregulated 1.4-fold (Be median ratio 0.17; unstimulated median ratio 0.12). Be exposure in the presence of the transcription inhibitor pentoxifylline (PTX) decreased CBD BAL cell TNF-alpha pre-mRNA levels > 60%, whereas treatment with the mRNA splicing inhibitor 2-aminopurine (2AP) decreased levels 40% relative to Be exposure alone. PTX treatment decreased mature TNF-alpha mRNA levels 50% while 2AP decreased levels > 80%, relative to Be exposure alone. Beryllium exposure specifically upregulated transcription factors AP-1 and NF-kappaB. The data suggest that Be exposure induces transcription-dependent TNF-alpha production, potentially due to upregulation of specific transcription factors.
Figures
Similar articles
-
Beryllium-induced tumor necrosis factor-alpha production by CD4+ T cells is mediated by HLA-DP.Am J Respir Cell Mol Biol. 2004 Jul;31(1):122-30. doi: 10.1165/rcmb.2003-0336OC. Epub 2004 Feb 19. Am J Respir Cell Mol Biol. 2004. PMID: 14975942
-
IL-4 fails to regulate in vitro beryllium-induced cytokines in berylliosis.Eur Respir J. 2001 Mar;17(3):403-15. doi: 10.1183/09031936.01.17304030. Eur Respir J. 2001. PMID: 11405518
-
High beryllium-stimulated TNF-alpha is associated with the -308 TNF-alpha promoter polymorphism and with clinical severity in chronic beryllium disease.Am J Respir Crit Care Med. 2001 Oct 1;164(7):1192-9. doi: 10.1164/ajrccm.164.7.2012123. Am J Respir Crit Care Med. 2001. PMID: 11673208
-
Role of the HLA-DP Glu 69 and the TNF-alpha TNF-alpha 2 gene markers in susceptibility to beryllium hypersensitivity.Int J Immunopathol Pharmacol. 2004 May-Aug;17(2 Suppl):3-10. doi: 10.1177/03946320040170S202. Int J Immunopathol Pharmacol. 2004. PMID: 15345185 Review.
-
Genetic and exposure risks for chronic beryllium disease.Clin Chest Med. 2002 Dec;23(4):827-39. doi: 10.1016/s0272-5231(02)00029-1. Clin Chest Med. 2002. PMID: 12516537 Review.
Cited by
-
Environment, Epigenetics, and Differential Responses to Beryllium Exposure: Are We There Yet?Am J Respir Cell Mol Biol. 2019 Jan;60(1):11-12. doi: 10.1165/rcmb.2018-0306ED. Am J Respir Cell Mol Biol. 2019. PMID: 30321053 Free PMC article. No abstract available.
-
Chronic beryllium disease: an updated model interaction between innate and acquired immunity.Biometals. 2011 Feb;24(1):1-17. doi: 10.1007/s10534-010-9376-3. Epub 2010 Oct 28. Biometals. 2011. PMID: 20981472 Free PMC article. Review.
-
The uses and adverse effects of beryllium on health.Indian J Occup Environ Med. 2009 Aug;13(2):65-76. doi: 10.4103/0019-5278.55122. Indian J Occup Environ Med. 2009. PMID: 20386622 Free PMC article.
-
Modulation of lymphocyte proliferation by antioxidants in chronic beryllium disease.Am J Respir Crit Care Med. 2008 May 1;177(9):1002-11. doi: 10.1164/rccm.200707-1021OC. Epub 2008 Jan 24. Am J Respir Crit Care Med. 2008. PMID: 18218990 Free PMC article.
-
Immunotoxicology of beryllium lung disease.Environ Health Prev Med. 2007 Jul;12(4):161-4. doi: 10.1007/BF02897985. Environ Health Prev Med. 2007. PMID: 21432059 Free PMC article.
References
-
- Sawyer RT, Maier LA, Kittle LA, Newman LS. Chronic beryllium disease: A model interaction between innate and acquired immunity. Int Immunopharmacol 2002;2:249–261. - PubMed
-
- Richeldi L, Sorrentino R, Saltini C. HLA-DPB1 glutamate 69: a genetic marker of beryllium disease. Science 1999;262:242–244. - PubMed
-
- Saltini C, Winestock K, Kirby M, Pinkston P, Crystal RG. Maintenance of alveolitis in patients with chronic beryllium disease by beryllium-specific helper T cells. N Engl J Med 1989;320:1103–1109. - PubMed
-
- Mroz MM, Kreiss K, Lezotte DC, Campbell PA, Newman LS. Re-examination of the blood lymphocyte transformation test in the diagnosis of chronic beryllium disease. J Allergy Clin Immunol 1991;88:54–60. - PubMed
Publication types
MeSH terms
Substances
Grants and funding
LinkOut - more resources
Full Text Sources
Research Materials
