. 2006 Oct;26(19):7056-67.
doi: 10.1128/MCB.01033-06.

Distinct functions of dispersed GATA factor complexes at an endogenous gene locus

Affiliations

Distinct functions of dispersed GATA factor complexes at an endogenous gene locus

Jeffrey A Grass et al. Mol Cell Biol. 2006 Oct.

Abstract

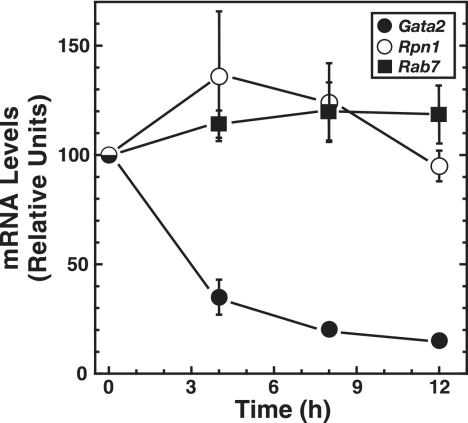
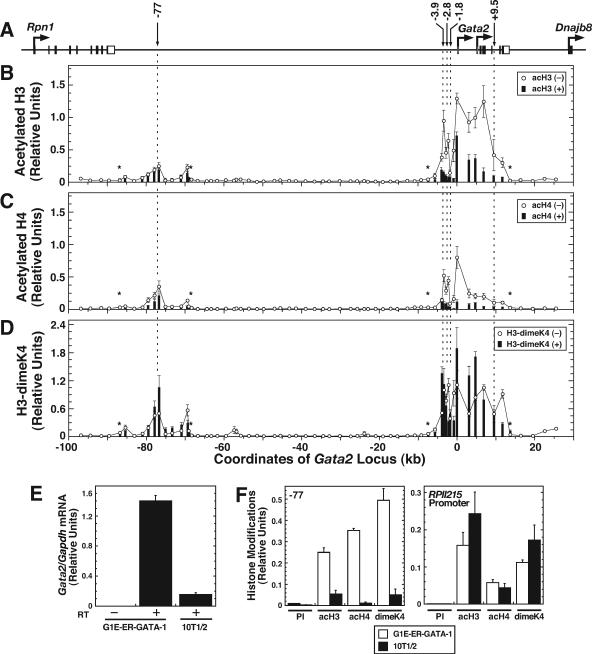
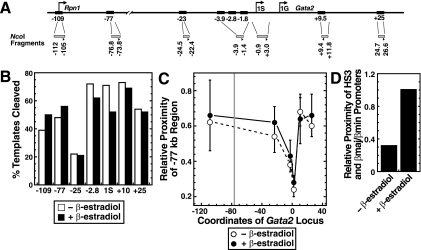
The reciprocal expression of GATA-1 and GATA-2 during hematopoiesis is an important determinant of red blood cell development. Whereas Gata2 is preferentially transcribed early in hematopoiesis, elevated GATA-1 levels result in GATA-1 occupancy at sites upstream of the Gata2 locus and transcriptional repression. GATA-2 occupies these sites in the transcriptionally active locus, suggesting that a "GATA switch" abrogates GATA-2-mediated positive autoregulation. Chromatin immunoprecipitation (ChIP) coupled with genomic microarray analysis and quantitative ChIP analysis with GATA-1-null cells expressing an estrogen receptor ligand binding domain fusion to GATA-1 revealed additional GATA switches 77 kb upstream of Gata2 and within intron 4 at +9.5 kb. Despite indistinguishable GATA-1 occupancy at -77 kb and +9.5 kb versus other GATA switch sites, GATA-1 functioned uniquely at the different regions. GATA-1 induced histone deacetylation at and near Gata2 but not at the -77 kb region. The -77 kb region, which was DNase I hypersensitive in both active and inactive states, conferred equivalent enhancer activities in GATA-1- and GATA-2-expressing cells. By contrast, the +9.5 kb region exhibited considerably stronger enhancer activity in GATA-2- than in GATA-1-expressing cells, and other GATA switch sites were active only in GATA-1- or GATA-2-expressing cells. Chromosome conformation capture analysis demonstrated higher-order interactions between the -77 kb region and Gata2 in the active and repressed states. These results indicate that dispersed GATA factor complexes function via long-range chromatin interactions and qualitatively distinct activities to regulate Gata2 transcription.


Figures

FIG. 1.
FIG. 1.
ChIP-chip analysis reveals ER-GATA-1 occupancy far upstream of Gata2. Gata2 locus organization is illustrated at the top. Open and filled boxes depict noncoding and coding exons, respectively. Arrows pointing down depict GATA switch sites and the −77 kb region. The VISTA plot depicts percent sequence identity between mouse and human (M/H) or mouse and dog (M/D) as a function of genomic coordinates. The first three ChIP-chip profiles depict results comparing chromatin immunoprecipitation with anti-GATA-1 and preimmune antibodies. The bottom three ChIP-chip profiles compare signals obtained upon immunoprecipitation with anti-GATA-1 antibody with that of input chromatin. Note that no qualitative differences were detected in the six ChIP-chip profiles. These results are representative of those obtained from three independent ChIP-chip experiments. The “peaks” delineated with Signal Map software represent the highest signal/background ratios obtained using default software settings.
FIG. 2.
FIG. 2.
Quantitative ChIP analysis of ER-GATA-1, GATA-2, and FOG-1 occupancy at the endogenous Gata2 locus. (A) Gata2 locus organization. Open and filled boxes depict noncoding and coding exons, respectively. Arrows pointing down depict GATA switch sites and the −77 kb region. The VISTA plot depicts sequence identity between mouse and human using the mouse sequence as a reference. Coordinate 1 reflects the first nucleotide of the Gata2 1S exon. (B to E) Quantitative ChIP analysis of ER-GATA-1 (B), GATA-2 (C), FOG-1 (β-estradiol-treated cells) (D), and FOG-1 (untreated cells) (E) chromatin occupancy at regions containing conserved nGATAn sites in untreated (transcriptionally active) or β-estradiol-treated (48 h) (transcriptionally repressed) G1E-ER-GATA-1 cells (mean ± standard error, two to three independent experiments). Asterisks indicate three nonconserved GATA sites residing within chromatin highly enriched in histone H3 and H4 acetylation and H3-dimeK4.
FIG. 3.
FIG. 3.
ER-GATA-1-mediated Gata2 repression is not associated with altered transcription of nearest-neighbor genes. Quantitative real-time RT-PCR was used to measure murine Gata2, Rpn1, and Rab7 mRNA levels in untreated or β-estradiol-treated (for 4, 8, and 12 h) G1E-ER-GATA-1 cells. The graph depicts relative mRNA levels normalized by the level of Gapdh mRNA (mean ± standard error, three independent experiments).
FIG. 4.
FIG. 4.
Concomitant GATA switches at multiple upstream regions and intron 4 of the Gata2 locus. (A) Sequential (1) and concomitant (2) GATA switch models. (B) Quantitative ChIP analysis of ER-GATA-1 and GATA-2 occupancy at −77, −3.9, −2.8, and +9.5 kb (intron 4) regions in untreated and β-estradiol-treated (10, 40, or 200 nM) G1E-ER-GATA-1 cells (mean ± standard error, four independent experiments).
FIG. 5.
FIG. 5.
ER-GATA-1 induces deacetylation at and near the Gata2 promoter and open reading frame but not at the −77 kb region. (A) Gata2 locus organization. Open and filled boxes depict noncoding and coding exons, respectively. Arrows pointing down depict GATA switch sites. The value 1 reflects the first nucleotide of the Gata2 1S exon. (B to D) Quantitative ChIP analysis of acH3 (B), acH4 (C), and H3-dimeK4 (D) across the locus with an average distance of 2 kb between primer sets in untreated and β-estradiol-treated (48 h) G1E-ER-GATA-1 cells (mean ± standard error, two to five independent experiments). Asterisks indicate the limit of signal detection in the treated condition. DNA immunoprecipitated with preimmune (PI) antibody was analyzed with all primer sets, and the average signal from all experiments is 0.0035. (E) RT-PCR analysis of Gata2 mRNA in untreated G1E-ER-GATA-1 and 10T1/2 cells. Gata2 mRNA levels were normalized by the levels of Gapdh mRNA. (F) Quantitative ChIP analysis of acH3, acH4, and H3-dimeK4 at the −77 kb region (left) and the constitutively active RPII215 promoter (right) in untreated G1E-ER-GATA-1 and 10T1/2 cells.
FIG. 6.
FIG. 6.
DNase I hypersensitivity at the −77 region. Nuclei were isolated from untreated or tamoxifen-treated (23 h) G1E-ER-GATA-1 cells and digested with increasing concentrations of DNase I. After cleavage of purified genomic DNA with BanI, fragments were analyzed by Southern blotting. The PhosphorImager scan shown is representative of three independent DNase I digests and analyses. The diagram on the right illustrates the Gata2 locus coordinates of fragments determined with genomic molecular size markers. 0, no-DNase I control.
FIG. 7.
FIG. 7.
Cell type-specific enhancer activity of the −77 kb region. (A) Sequence of the −77 and +9.5 kb regions analyzed in the transient-transfection assay. Conserved GATA motifs within the −77 and +9.5 kb fragments are highlighted. (B) G1E and MEL cells were transiently transfected with reporter plasmids derived from the pGL3 luciferase vector containing the Gata2 1S promoter cloned upstream of luciferase (1SLuc): the GATA motifs were intact in the (−77)1SLuc, (−3.9)1SLuc, and (+9.5)1SLuc plasmids, whereas the GATA motifs were mutated in the (−77mt1)1SLuc, (−77mt2)1SLuc, (−77mt3)1SLuc, and (+9.5mt)1SLuc plasmids. Mutations: −77mt1, TTATCA to TATGAA; −77mt2, GGATAC to ACGCGT; −77mt3, CTATCTATCA to TAGCTAGCGT; +9.5mt, CTATCC to ACGCGT, AGATAA to GACTTC, and GTATCT to GCTAGC. The plots depict luciferase activities of the cell lysates normalized by the protein concentrations of the lysates. The activity of the 1SLuc construct was designated 1.0 (mean ± standard error, 3 to 12 independent experiments). In each experiment, transfections were performed in triplicate. RLU, relative luciferase units. (C) Summary of enhancer activities of the GATA switch sites. +, enhancer activity; +++, strong enhancer activity (∼30-fold); −, no enhancer activity. Parentheses indicate results from our previously published study (35).
FIG. 8.
FIG. 8.
Differential CBP/p300 occupancy at the −77, −3.9, and +9.5 versus the −1.8 kb GATA switch site. CBP/p300 occupancy was measured in untreated and β-estradiol-treated (48 h) G1E-ER-GATA-1 cells by quantitative ChIP analysis at the −77, −3.9, −1.8, and +9.5 kb GATA switch sites and the −46 kb region, which lacks known regulatory sequences (mean ± standard error, three independent experiments).
FIG. 9.
FIG. 9.
Close proximity of the −77 and +9.5 kb GATA switch sites at the endogenous Gata2 locus. (A) The diagram depicts the 3C strategy. NcoI fragments and primers are depicted as shaded rectangles and triangles, respectively. (B) The graph depicts NcoI cleavage efficiencies at the indicated sites determined via real-time PCR. (C) The graph depicts 3C results from four independent experiments (mean ± standard error) measuring the proximity of an NcoI fragment containing the −77 kb region relative to fragments containing the −2.8 and +9.5 kb GATA switch sites, the 1S promoter, −23 kb and +25 kb regions lacking known regulatory elements, or the Rpn1 promoter in untreated or β-estradiol-treated G1E-ER-GATA-1 cells. The vertical gray bar indicates the position of the −77 kb region. Solid line, β-estradiol treated; dotted line, no β-estradiol. (D) The graph depicts a 3C analysis of the relative proximity of β-globin HS3 and the βmajor/βminor promoters (mean, two independent experiments).

Similar articles

Cited by

References

    1. Anguita, E., J. Hughes, C. Heyworth, G. A. Blobel, W. G. Wood, and D. R. Higgs. 2004. Globin gene activation during hematopoiesis is driven by protein complexes nucleated by GATA-1 and GATA-2. EMBO J. 23:2841-2852. - PMC - PubMed
    1. Blobel, G. A., T. Nakajima, R. Eckner, M. Montminy, and S. H. Orkin. 1998. CREB-binding protein cooperates with transcription factor GATA-1 and is required for erythroid differentiation. Proc. Natl. Acad. Sci. USA 95:2061-2066. - PMC - PubMed
    1. Bresnick, E. H., K. D. Johnson, S.-I. Kim, and H. Im. 2006. Establishment and regulation of chromatin domains: mechanistic insights from studies of hemoglobin synthesis. Prog. Nucleic Acids Res. Mol. Biol. 81:435-471. - PubMed
    1. Bresnick, E. H., M. L. Martowicz, S. Pal, and K. D. Johnson. 2005. Developmental control via GATA factor interplay at chromatin domains. J. Cell. Physiol. 205:1-9. - PubMed
    1. Cantor, A. B., S. G. Katz, and S. H. Orkin. 2002. Distinct domains of the GATA-1 cofactor FOG-1 differentially influence erythroid versus megakaryocytic maturation. Mol. Cell. Biol. 22:4268-4279. - PMC - PubMed

Publication types

MeSH terms

LinkOut - more resources