. 2006 Oct;26(19):7155-66.
doi: 10.1128/MCB.00507-06.

Persistence of cooperatively stabilized signaling clusters drives T-cell activation

Affiliations

Persistence of cooperatively stabilized signaling clusters drives T-cell activation

Stephen C Bunnell et al. Mol Cell Biol. 2006 Oct.

Abstract

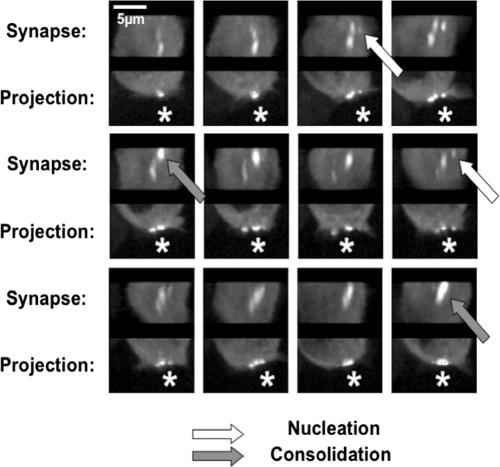
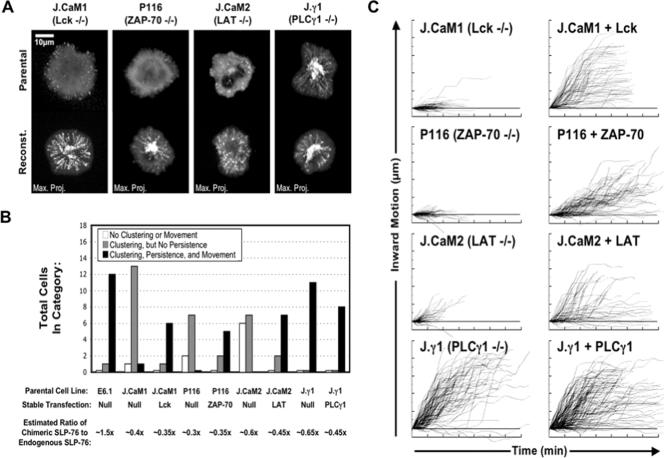
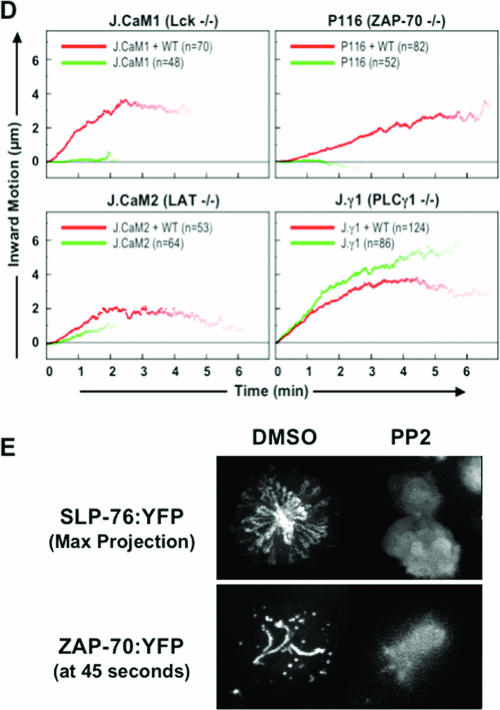
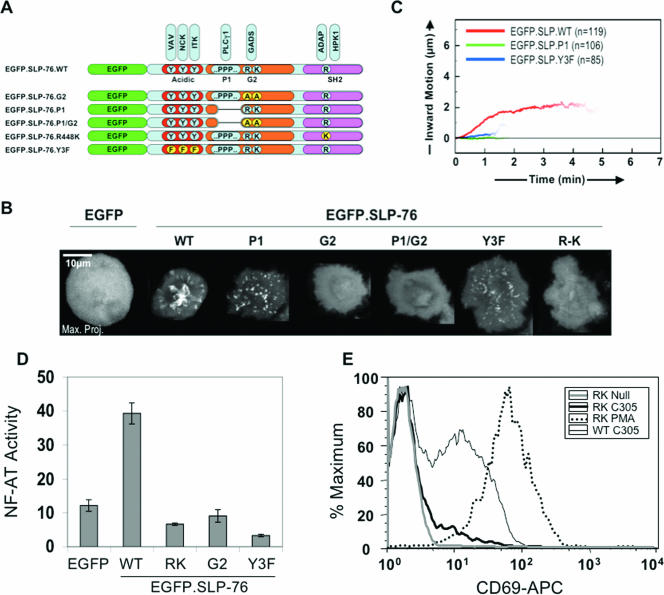
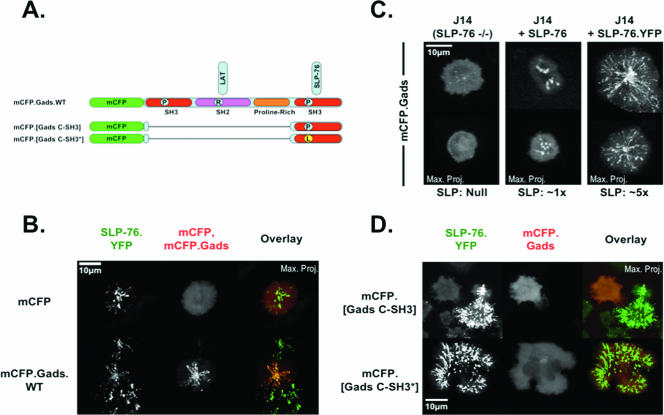
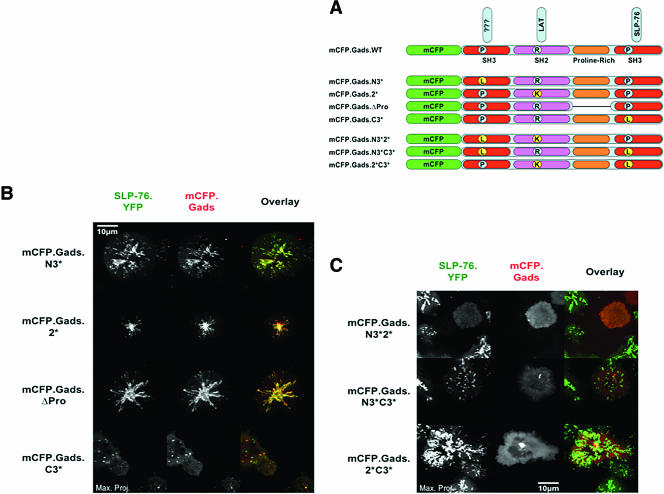
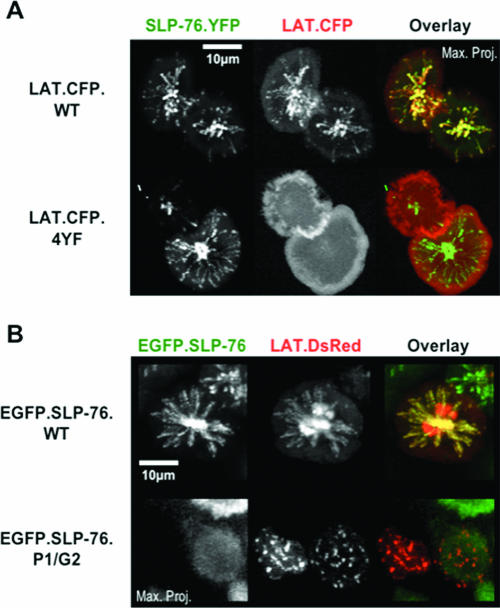
Antigen recognition triggers the recruitment of the critical adaptor protein SLP-76 to small macromolecular clusters nucleated by the T-cell receptor (TCR). These structures develop rapidly, in parallel with TCR-induced increases in tyrosine phosphorylation and cytosolic calcium, and are likely to contribute to TCR-proximal signaling. Previously, we demonstrated that these SLP-76-containing clusters segregate from the TCR and move towards the center of the contact interface. Neither the function of these clusters nor the structural requirements governing their persistence have been examined extensively. Here we demonstrate that defects in cluster assembly and persistence are associated with defects in T-cell activation in the absence of Lck, ZAP-70, or LAT. Clusters persist normally in the absence of phospholipase C-gamma1, indicating that in the absence of a critical effector, these structures are insufficient to drive T-cell activation. Furthermore, we show that the critical adaptors LAT and Gads localize with SLP-76 in persistent clusters. Mutational analyses of LAT, Gads, and SLP-76 indicated that multiple domains within each of these proteins contribute to cluster persistence. These data indicate that multivalent cooperative interactions stabilize these persistent signaling clusters, which may correspond to the functional complexes predicted by kinetic proofreading models of T-cell activation.


Figures

FIG. 1.
FIG. 1.
SLP-76-containing complexes in SEE-induced synapses. J14 Jurkat T cells stably expressing SLP-76.YFP were allowed to form synapses in the presence of Nalm-6 B cells and 5 μg/ml SEE. Conjugates were detected 10 to 20 min after the initiation of the assay. SLP-76-containing complexes were observed in the synapses of all conjugates. SLP-76 was imaged within synapses by continuously collecting three-dimensional image sets spanning the synapse. Images were collected with a vertical spacing of 0.3 μm, and full image sets were collected every 16 seconds. The images shown here were collected at 32-second intervals. At each time point, two views of the synapse were created, including a maximum projection of the entire image set, revealing all of the clusters in the synapse in a single image, and a reconstructed head-on view of the synapse. Asterisks mark the position of the Nalm-6 B cell, and arrows identify sites of SLP-76 nucleation (white) and consolidation (gray).
FIG.2.
FIG.2.
Genetic requirements for complex assembly. Jurkat variants and their stably reconstituted partners were transiently transfected with SLP-76.YFP. (A) Maximum-over-time projections are shown for representative mutant (top row) and reconstituted (bottom row) cells. (B) Summary of the observed microcluster phenotypes in transiently transfected cells. For each condition, at least three independent transfections were performed, and three to five imaging runs were performed per transfection. All cells meeting the expression criteria described in Materials and Methods were sorted into the following three categories: cells displaying no clustering, cells displaying transient clusters that failed to move, and cells displaying persistent, mobile clusters. Overexpression of the SLP-76 chimera was estimated on a per-cell basis by comparing the experimental exposure time to the time required to image a cell expressing a known amount of an identical chimera (not shown). (C) Movement traces of the most persistent and mobile complexes observed in each cell were extracted and compiled into composite kymographs. This approach understates the defects observed in nonreconstituted cell lines. (D) Mean translocation plots were compiled from the individual movement traces shown in panel C. The numbers of traces compiled are indicated. (E) Jurkat T cells stably expressing either SLP-76.YFP or ZAP-70.YFP were assayed for complex formation after a 30-min pretreatment with 10 μM PP2 or with carrier alone (dimethyl sulfoxide [DMSO]). Maximum-over-time projections are shown for representative SLP-76.YFP-expressing cells (top row), whereas still frames are shown for the ZAP-70.YFP-expressing cells (bottom row).
FIG.2.
FIG.2.
Genetic requirements for complex assembly. Jurkat variants and their stably reconstituted partners were transiently transfected with SLP-76.YFP. (A) Maximum-over-time projections are shown for representative mutant (top row) and reconstituted (bottom row) cells. (B) Summary of the observed microcluster phenotypes in transiently transfected cells. For each condition, at least three independent transfections were performed, and three to five imaging runs were performed per transfection. All cells meeting the expression criteria described in Materials and Methods were sorted into the following three categories: cells displaying no clustering, cells displaying transient clusters that failed to move, and cells displaying persistent, mobile clusters. Overexpression of the SLP-76 chimera was estimated on a per-cell basis by comparing the experimental exposure time to the time required to image a cell expressing a known amount of an identical chimera (not shown). (C) Movement traces of the most persistent and mobile complexes observed in each cell were extracted and compiled into composite kymographs. This approach understates the defects observed in nonreconstituted cell lines. (D) Mean translocation plots were compiled from the individual movement traces shown in panel C. The numbers of traces compiled are indicated. (E) Jurkat T cells stably expressing either SLP-76.YFP or ZAP-70.YFP were assayed for complex formation after a 30-min pretreatment with 10 μM PP2 or with carrier alone (dimethyl sulfoxide [DMSO]). Maximum-over-time projections are shown for representative SLP-76.YFP-expressing cells (top row), whereas still frames are shown for the ZAP-70.YFP-expressing cells (bottom row).
FIG. 3.
FIG. 3.
SLP-76 domains contribute to complex assembly and T-cell activation. (A) Schematic of EGFP.SLP-76 and mutant variants. (B) Complex formation and movement in J14 cells stably reconstituted with EGFP, wild-type EGFP.SLP-76, or EGFP.SLP-76 are displayed using representative maximum-over-time projections. Images were acquired from multiple runs performed over three or more independent experiments. (C) Translocation plots display the mean persistence and translocation of complexes observed as described for panel B. For each plot, traces were acquired from 4 to 10 representative cells identified from multiple imaging runs performed in two or more independent experiments. The numbers of traces compiled are indicated. (D) NF-AT-luciferase activation assays were performed in SLP-76-deficient cell lines stably transfected with the indicated EGFP.SLP-76 chimeras or in control cells expressing EGFP alone. Stimulation was performed on immobilized antibodies in glass-bottomed 96-well plates. The standard deviations of triplicate samples are shown. Similar results were obtained in three experiments. (E) SLP-76-deficient Jurkat T cells stably reconstituted with wild-type SLP-76 (WT) or with SH2 domain mutant SLP-76 (RK) were stimulated and stained for CD69.
FIG. 4.
FIG. 4.
SLP-76 and Gads cooperate to stabilize complexes. (A) Schematic of Gads chimeras tagged with monomeric CFP (mCFP) at the amino terminus. (B) mCFP and the wild-type mCFP.Gads chimera were transiently expressed in J14 cells stably reconstituted with SLP-76.YFP. Complex formation assays were performed, and the resulting maximum-over-time projections are shown for YFP (left panels, green overlay) and mCFP (middle panels, red overlay). (C) mCFP.Gads was transiently transfected into J14 cells, J14 cells stably reconstituted with moderate levels of untagged SLP-76, and J14 cells stably reconstituted with high levels of SLP-76.YFP. The resulting cells were stimulated, and mCFP-Gads was imaged. Two representative maximum-over-time projections are shown for each condition. (D) The mCFP-tagged C-terminal SH3 domain of Gads and an identical construct with an inactivated SH3 domain were transiently transfected into J14 cells stably reconstituted with SLP-76.YFP. Complex formation assays were performed, and maximum-over-time projections are shown for both SLP-76 (left panels, green overlay) and the wild-type and mutant dominant-negative constructs (middle panels, red overlay).
FIG. 5.
FIG. 5.
Gads domains contribute to complex assembly. (A) Schematic of mCFP.Gads mutants. (B) mCFP.Gads constructs containing mutations in individual domains were transiently transfected into J14 cells stably reconstituted with SLP-76.YFP. Complex formation assays were performed, and maximum-over-time projections for both SLP-76 (left panels, green overlay) and Gads (middle panels, red overlay) are presented for representative cells. (C) mCFP.Gads constructs containing mutations in multiple domains were analyzed as described for panel B.
FIG. 6.
FIG. 6.
Protein-protein scaffolds recruit LAT into signaling complexes. (A) Wild-type (LAT.CFP.WT) and tyrosine mutant (LAT.CFP.4YF) LAT chimeras were transiently transfected into J14 cells stably reconstituted with SLP-76.YFP. Complex formation assays were performed, and maximum-over-time projections for both SLP-76 (left panels, green overlay) and LAT (middle panels, red overlay) are presented for representative cells. (B) LAT.DsRed was transiently transfected into J14 cells stably expressing either a wild-type (EGFP.SLP-76.WT) or mutant (EGFP.SLP-76.P1/G2) SLP-76 chimera. Although the recipient cell lines were matched for SLP-76 expression by flow cytometry, rare cells did not express the SLP-76 chimera (bottom row). Complex formation assays were performed, and maximum-over-time projections for both SLP-76 (left panels, green overlay) and LAT (middle panels, red overlay) are presented for representative cells.

Similar articles

Cited by

References

    1. Balamuth, F., D. Leitenberg, J. Unternaehrer, I. Mellman, and K. Bottomly. 2001. Distinct patterns of membrane microdomain partitioning in Th1 and Th2 cells. Immunity 15:729-738. - PubMed
    1. Barda-Saad, M., A. Braiman, R. Titerence, S. C. Bunnell, V. A. Barr, and L. E. Samelson. 2005. Dynamic molecular interactions linking the T cell antigen receptor to the actin cytoskeleton. Nat. Immunol. 6:80-89. - PubMed
    1. Berry, D. M., P. Nash, S. K. Liu, T. Pawson, and C. J. McGlade. 2002. A high-affinity Arg-X-X-Lys SH3 binding motif confers specificity for the interaction between Gads and SLP-76 in T cell signaling. Curr. Biol. 12:1336-1341. - PubMed
    1. Boerth, N. J., J. J. Sadler, D. E. Bauer, J. L. Clements, S. M. Gheith, and G. A. Koretzky. 2000. Recruitment of SLP-76 to the membrane and glycolipid-enriched membrane microdomains replaces the requirement for linker for activation of T cells in T cell receptor signaling. J. Exp. Med. 192:1047-1058. - PMC - PubMed
    1. Boniface, J. J., J. D. Rabinowitz, C. Wulfing, J. Hampl, Z. Reich, J. D. Altman, R. M. Kantor, C. Beeson, H. M. McConnell, and M. M. Davis. 1998. Initiation of signal transduction through the T cell receptor requires the multivalent engagement of peptide/MHC ligands. Immunity 9:459-466. - PubMed

Publication types

MeSH terms