Comparative Study
. 2006 Oct;8(10):1155-62.
doi: 10.1038/ncb1477. Epub 2006 Sep 17.

The chaperonin TRiC controls polyglutamine aggregation and toxicity through subunit-specific interactions

Affiliations
Comparative Study

The chaperonin TRiC controls polyglutamine aggregation and toxicity through subunit-specific interactions

Stephen Tam et al. Nat Cell Biol. 2006 Oct.

Abstract

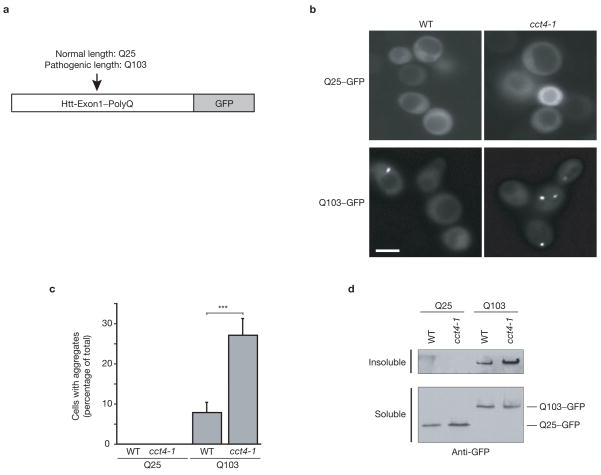
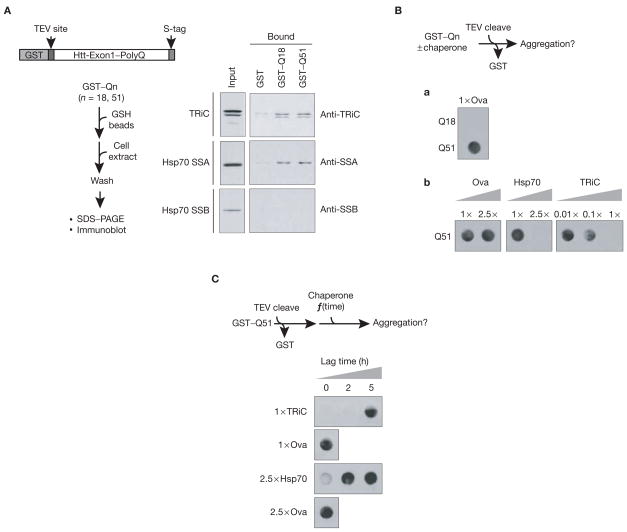
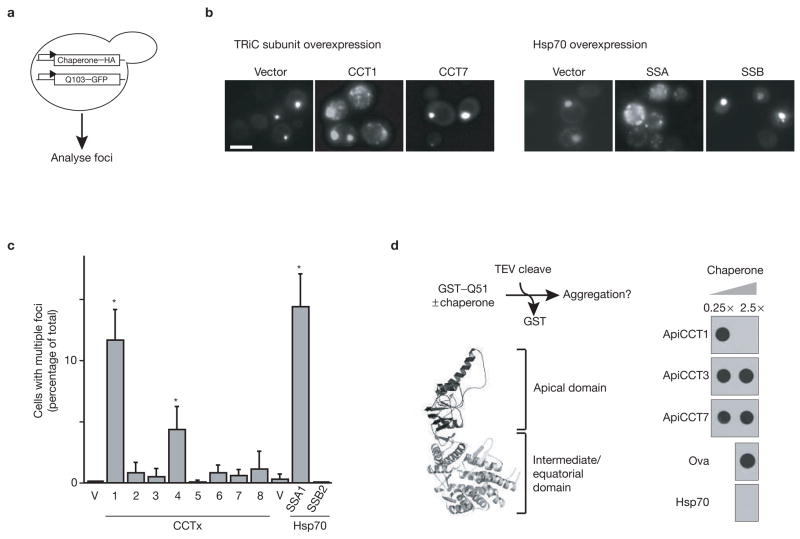
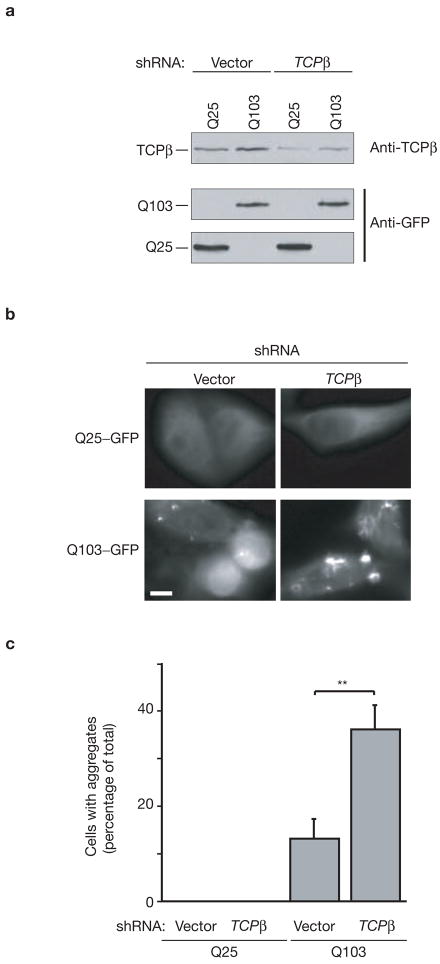
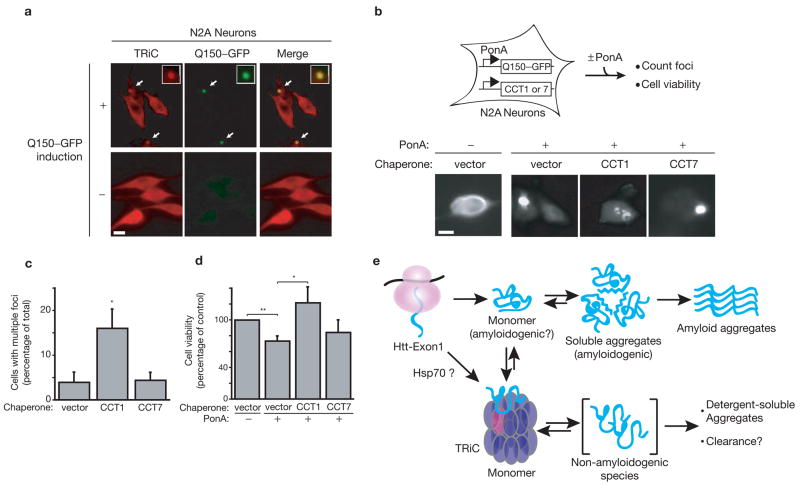
Misfolding and aggregation of proteins containing expanded polyglutamine repeats underlie Huntington's disease and other neurodegenerative disorders. Here, we show that the hetero-oligomeric chaperonin TRiC (also known as CCT) physically interacts with polyglutamine-expanded variants of huntingtin (Htt) and effectively inhibits their aggregation. Depletion of TRiC enhances polyglutamine aggregation in yeast and mammalian cells. Conversely, overexpression of a single TRiC subunit, CCT1, is sufficient to remodel Htt-aggregate morphology in vivo and in vitro, and reduces Htt-induced toxicity in neuronal cells. Because TRiC acts during de novo protein biogenesis, this chaperonin may have an early role preventing Htt access to pathogenic conformations. Based on the specificity of the Htt-CCT1 interaction, the CCT1 substrate-binding domain may provide a versatile scaffold for therapeutic inhibitors of neurodegenerative disease.


Conflict of interest statement

COMPETING FINANCIAL INTERESTS

The authors declare that they have no competing financial interests.

Figures

Figure 1
Figure 1
Impaired TRiC function increases PolyQ-expanded huntingtin aggregation in budding yeast. (a) N-terminal Htt-exon1 fragment fused to C-terminal GFP (Htt-exon1–Qn–GFP: n = length of polyQ tract = 25 or 103) was used to monitor aggregation in vivo. (b) Fluorescence microscopy of Htt-exon1–Qn–GFP (Qn–GFP) in wild-type (WT) or TRiC mutant (cct4-1) cells as described in methods. The scale bar represents 5 μm. (c) Cells from b were scored for foci by visual inspection of GFP aggregates. Statistical analysis was performed using the one-sided, paired Student’s t-test: mean ± s.e.m. of five independent experiments counting at least 200 cells each are shown (***P < 0.001). (d) Equivalent amounts of yeast cell lysates prepared from b were analysed for SDS-insoluble aggregates by anti-GFP immunoblot for high molecular weight species as previously described. SDS-insoluble aggregates are retained in the stacking gel and SDS-soluble material enters the resolving gel. Representative results of at least three independent experiments are shown. See Supplementary Information, Fig. S5 for an uncropped image of the blot.
Figure 2
Figure 2
TRiC physically interacts with and directly suppresses aggregation of PolyQ-expanded huntingtin. (A) All pulldown and in vitro aggregation assays were carried out as described in the methods using Htt-exon1 carrying a C-terminal S-tag and an N-terminal GST moiety followed by a TEV protease cleavage site (GST–Qn). Isolation of cellular chaperones that interact with Htt was carried out by GST–Qn pulldown using glutathione–Sepharose (GSH) beads. Associated chaperones were detected by immunoblotting. Input was 5% total protein used in pulldown. See Supplementary Information, Fig. S5 for an uncropped image of the blot. (B) In vitro GST–Qn aggregation assay. SDS-insoluble, heat-stable aggregates were filter-trapped as described in the methods and detected by anti-S-tag immunoblot. GST–Qn aggregation was assessed 6 h after TEV protease cleavage. Hsp70 served as a positive control and ovalbumin (Ova) as a non-specific negative control. Pathogenic length GST–Q51, but not normal length GST–Q18, forms SDS-insoluble, heat-stable aggregates (a). Chaperone-mediated suppression of GST–Q51 (b). Aggregation was assessed at indicated chaperone: GST–Q51 molar ratios. Chaperone addition did not inhibit TEV protease-mediated cleavage of GST–Q51 in vitro (data not shown). (C) Time course of chaperone addition. In vitro GST–Qn aggregation was initiated by TEV protease cleavage and indicated chaperone added at 0, 2, or 5 h post-TEV treatment. Reactions were stopped after 6 h and assayed as in B. Representative results of at least three independent experiments are shown.
Figure 3
Figure 3
Specific TRiC subunits directly modulate PolyQ-expanded huntingtin aggregate morphology. (a) Q103–GFP and chaperone–HA were co-overexpressed in wild-type (WT) cells for 24 h before analysis. (b) Fluorescence microscopy of Q103–GFP on coexpression of individual TRiC subunits (CCTx; x = subunits 1–8, shown for CCT1 and CCT7) and the yeast Hsp70s SSA1 and SSB2. The scale bar represents 5 μm. (c) Effect of chaperone overexpression on aggregate morphology. Distinct Q103–GFP aggregate morphologies, large single foci or multiple smaller diffuse aggregates, were assessed by visual inspection of GFP aggregates from b. Backbone vectors (V), were used as negative controls for TRiC subunits and SSA1, SSB2. Statistical analysis was performed using the one-sided, paired Student’s t-test: mean ± s.e.m. of three independent experiments counting at least 200 cells each are shown (*P <0.05). (d) Purified CCT1 apical domain specifically inhibits polyQ aggregation in vitro. A ribbon diagram of TRiC subunit domain architecture (modelled on an archaeal homologue, PBD accession number: 1A6E) is shown. Suppression of GST–Q51 aggregation by purified apical domains (ApiCCTx) corresponding to three TRiC subunits (CCT1, CCT3 and CCT7) was assessed at the indicated chaperone: GST–Q51 molar ratios as in Fig. 2b. Hsp70: positive control. Ova: non-specific protein control. Representative results of at least three independent experiments are shown.
Figure 4
Figure 4
Impaired TRiC function increases PolyQ-expanded huntingtin aggregation in mammalian cells. (a) Qn–GFP (n = 25, 103) and shRNA against TRiC subunit TCPβ were coexpressed by transient transfection in HeLa cells. TCPβ downregulation and Qn–GFP (n = 25, 103) expression were assessed by immunoblot analysis. TCPβ levels were reduced by at least 50–60% using shRNA targeting TCPβ, without affecting Qn–GFP expression levels. (b) Fluorescence microscopy of Qn–GFP (n = 25, 103) expressing HeLa cells from a. The scale bars represent 10 μm. (c) Cells from b were scored for foci by visual inspection of GFP aggregates. Statistical analysis was performed using the one-sided, paired Student’s t-test: mean ± s.e.m. of three independent experiments counting at least 200 cells each are shown (**P <0.01).
Figure 5
Figure 5
TRiC modulates aggregation of PolyQ-expanded huntingtin and alleviates cytotoxicity in neurons. (a) TRiC colocalizes with PolyQ-expanded huntingtin in neurons. TRiC and Q150–GFP localization was detected by anti-TCPβ immunofluorescence and GFP fluorescence in Q150–GFP N2A neurons, respectively. The degree of colocalization was illustrated by merging TRiC and Q150–GFP images (merge). In control cells (−), Q150–GFP expression was not induced with PonA. Inset: larger image of a single aggregate highlights colocalization of TRiC with Htt aggregates in neurons. The scale bar represents 10 μm. (b) Fluorescence microscopy of Q150–GFP N2A neurons transiently transfected with CCT1, CCT7 or vector alone. In the control (−), Q150–GFP expression was not induced with PonA, but background Q150–GFP expression could still be detected. The scale bar represents 10 μm. (c) Q150–GFP aggregate morphology was assessed by visual inspection of GFP aggregates from b. Statistical analysis was performed using the one-sided, paired Student’s t-test: mean ± s.e.m. of four independent experiments counting at least 200 cells each are shown. (d) Cell viability was assessed by trypan blue staining of neurons from b and normalized to uninduced control (−). Statistical analysis was performed using the one-sided, paired Student’s t-test: mean ± s.e.m. of five independent experiments counting at least 200 cells each are shown (*P <0.05; **P <0.01). (e) Role of the chaperonin TRiC in huntingtin biogenesis. Htt appears to interact with TRiC regardless of the polyQ length; the chaperonin partitions the Htt monomer away from the amyloidogenic pathway by promoting non-toxic conformations that can either be cleared and/or form detergent-soluble amorphous aggregates. This Htt–TRiC interaction is mediated by subunits CCT1–TCPβ and/or CCT4–TCPδ. The interaction seems to occur early in the aggregation pathway and may occur in cooperation with Hsp70.

Similar articles

Cited by

References

    1. Zoghbi HY, Orr HT. Glutamine repeats and neurodegeneration. Annu Rev Neurosci. 2000;23:217–247. - PubMed
    1. Frydman J, Nimmesgern E, Ohtsuka K, Hartl FU. Folding of nascent polypeptide chains in a high molecular mass assembly with molecular chaperones. Nature. 1994;370:111–117. - PubMed
    1. Soto C. Unfolding the role of protein misfolding in neurodegenerative diseases. Nature Rev Neurosci. 2003;4:49–60. - PubMed
    1. Muchowski PJ, Wacker JL. Modulation of neurodegeneration by molecular chaperones. Nature Rev Neurosci. 2005;6:11–22. - PubMed
    1. Scherzinger E, et al. Self-assembly of polyglutamine-containing huntingtin fragments into amyloid-like fibrils: implications for Huntington’s disease pathology. Proc Natl Acad Sci USA. 1999;96:4604–4609. - PMC - PubMed

Publication types