. 2006 Dec;26(23):8840-56.
doi: 10.1128/MCB.01846-05. Epub 2006 Sep 18.

MDM2 is required for suppression of apoptosis by activated Akt1 in salivary acinar cells

Affiliations

MDM2 is required for suppression of apoptosis by activated Akt1 in salivary acinar cells

Kirsten H Limesand et al. Mol Cell Biol. 2006 Dec.

Abstract

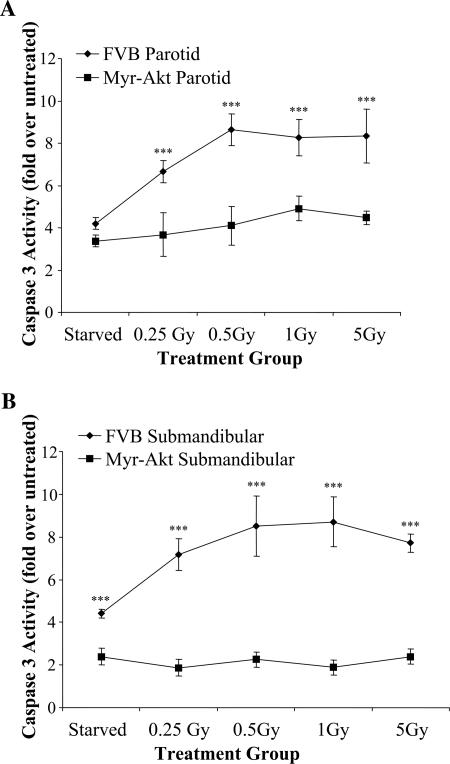
Chronic damage to the salivary glands is a common side effect following head and neck irradiation. It is hypothesized that irreversible damage to the salivary glands occurs immediately after radiation; however, previous studies with rat models have not shown a causal role for apoptosis in radiation-induced injury. We report that etoposide and gamma irradiation induce apoptosis of salivary acinar cells from FVB control mice in vitro and in vivo; however, apoptosis is reduced in transgenic mice expressing a constitutively activated mutant of Akt1 (myr-Akt1). Expression of myr-Akt1 in the salivary glands results in a significant reduction in phosphorylation of p53 at serine(18), total p53 protein accumulation, and p21(WAF1) or Bax mRNA following etoposide or gamma irradiation of primary salivary acinar cells. The reduced level of p53 protein in myr-Akt1 salivary glands corresponds with an increase in MDM2 phosphorylation in vivo, suggesting that the Akt/MDM2/p53 pathway is responsible for suppression of apoptosis. Dominant-negative Akt blocked phosphorylation of MDM2 in salivary acinar cells from myr-Akt1 transgenic mice. Reduction of MDM2 levels in myr-Akt1 primary salivary acinar cells with small interfering RNA increases the levels of p53 protein and renders these cells susceptible to etoposide-induced apoptosis in spite of the presence of activated Akt1. These results indicate that MDM2 is a critical substrate of activated Akt1 in the suppression of p53-dependent apoptosis in vivo.


Figures

FIG. 1.
FIG. 1.
Identification of myr-Akt1 transgenic mice. Tissue lysates were prepared from 4-week-old female mice. (A) Protein lysates (100 μg) isolated from the salivary glands of mice in each founder line were electrophoresed on an 8% SDS-polyacrylamide gel and immunoblotted with an antibody that detects the HA tag. Membranes were stripped and immunoblotted with a total ERK antibody to confirm equal loading of lanes (bottom panel). (B) Total Akt levels were analyzed in FVB salivary glands and compared to salivary glands from myr-Akt1 founder line 1699. Membranes were stripped and immunoblotted with a total ERK antibody to confirm equal loading of lanes (bottom panel). (C) Total Akt was immunoprecipitated from tissue lysates (300 μg) (n = 4 [each genotype]) and used in an immune complex protein kinase assay containing [γ-32P]ATP and a specific substrate peptide (RPRAATF). The incorporation of 32P into the substrate peptide was determined by liquid scintillation counting and was plotted as average counts per minute. (D) Phosphorylation of GSK3α/β on serine9 was analyzed in tissue lysates by immunoblot analysis with anti-phospho-GSK3. Membranes were stripped and immunoblotted with a total GSK3β antibody to confirm equal loading of lanes (bottom panel).
FIG. 2.
FIG. 2.
Histological examination of salivary gland structure (×200). Submandibular (a and d), sublingual (b and e), and parotid (c and f) salivary glands from 4-week-old female animals were isolated from myr-Akt1 transgenic (a to c) and FVB control (d to f) mice. Tissues were fixed in 10% formalin, sectioned, stained with hematoxylin and eosin, and examined by bright-field microscopy. Magnification bars, 100 μm.
FIG. 3.
FIG. 3.
Induction of apoptosis by etoposide is diminished in salivary acinar cells from myr-Akt1 transgenic mice. Four days after initiation of the cultures, primary salivary acinar cells were treated with increasing doses of etoposide for 18 h. (A) All adherent and nonadherent primary parotid acinar cells were collected and lysed in caspase lysis buffer (BioMol QuantiZyme Colorimetric assay kit), and 15 μg of cell lysate was used to analyze the level of enzyme activity for each sample in quadruplicate. The ability of the enzyme to cleave a chromogenic substrate was read at A405 every 10 minutes for 7 hours, and the increase relative to untreated parotid cells is plotted. No statistical differences were detected between untreated FVB and untreated myr-Akt1 parotid lysates (P > 0.62). (B) Primary submandibular acinar cells were collected in caspase lysis buffer as described above, and the increase relative to untreated submandibular cells is plotted. No statistical differences were detected between untreated FVB and untreated myr-Akt1 submandibular lysates (P > 0.95). Graphs of caspase activity represent all data points collected from five independent experiments, and Student's t test P values, comparing two different treatment groups, were calculated by Microsoft Excel. Asterisks designate significant differences (P ≤ 0.05) between myr-Akt1 and FVB mice.
FIG. 4.
FIG. 4.
Salivary acinar cells from myr-Akt1 transgenic mice are resistant to gamma-irradiation-induced apoptosis. Four days after initiation of the cultures, primary salivary acinar cells were treated with increasing doses of gamma irradiation, and the extent of apoptosis was quantitated after 24 h. (A) All adherent and nonadherent primary parotid acinar cells were collected, the activation of caspase 3 was determined as described in the legend to Fig. 3A, and the increase relative to untreated parotid cells is plotted. (B) Primary submandibular acinar cells were exposed to various concentrations of gamma irradiation, the activation of caspase 3 was quantitated as described in the legend to Fig. 3A, and the increase relative to untreated submandibular cells is plotted. Caspase graphs represent all data points collected from five independent experiments (mean ± standard error of the mean), and Student's t test P values, comparing two different treatment groups, were calculated by Microsoft Excel. Asterisks designate significant differences (P ≤ 0.05) between myr-Akt1 and FVB calculated with a two-sample t test.
FIG. 5.
FIG. 5.
Reduced apoptosis in myr-Akt1 transgenic mice following targeted head and neck gamma irradiation in vivo. (A) Four-week-old female FVB (left panel) and myr-Akt1 transgenic (right panel) mice were exposed to 5 Gy irradiation, and the number of apoptotic cells in the parotid glands was quantitated by anti-activated caspase 3 immunohistochemistry at 24 h postirradiation. Magnification bars, 100 μm. (B) At 8 and 24 h after irradiation, the percentage of activated caspase 3-positive cells was calculated from parotid glands isolated from FVB and myr-Akt1 transgenic mice. The graph represents all data points from three mice per group (mean ± standard error of the mean). Cell counts were performed on a minimum of five fields of view per slide from three mice (total cells counted ranged from 1,800 to 2,500 per mouse). Asterisks designate significant differences (P ≤ 0.05) between myr-Akt1 and FVB calculated with a two-sample t test in Microsoft Excel. (C) At 8 and 24 h after irradiation, tissue lysates were prepared as described for Fig. 1 and immunoblotted with anti-phospho-p53 (serine18, top panel) or anti-HA to detect transgene (second panel). Membranes were stripped and immunoblotted with an anti-ERK antibody to confirm equal loading of lanes (bottom panel).
FIG. 6.
FIG. 6.
Expression of p53 family members and p21WAF1 is reduced in salivary glands of myr-Akt1 transgenic mice. (A) Tissue lysates were immunoblotted with anti-p53 (DO12) to detect total levels of p53 (top panel) or levels of phosphorylated MDM2serine163 (second panel) or total levels of MDM2 (third panel). Membranes were stripped and immunoblotted with an anti-ERK antibody to confirm equal loading of lanes (bottom panel). (B) Total cellular RNA isolated from untreated parotid glands (n = 4/genotype) was analyzed by real-time RT-PCR for basal concentrations of p21WAF1. p21WAF1 CT values were normalized by S15 CT values and are expressed as the ratio of p21WAF1 expression to S15 expression. The Student's t test P value, comparing two different treatment groups, was calculated with Microsoft Excel (P ≤ 0.025). (C) Parotid tissue lysates were analyzed for total levels of p21WAF1. The membrane was stripped and immunoblotted with an anti-ERK antibody to confirm equal loading of lanes (bottom panel). (D) Tissue lysates were analyzed for total levels of p63 (top panel) and p73 (middle panel). Membranes were stripped and immunoblotted with an anti-ERK antibody to confirm equal loading of lanes (bottom panel). Immunoblots are representative of three individual mice.
FIG. 7.
FIG. 7.
Diminished levels of p53 in primary myr-Akt1 salivary acinar cells following DNA damage. (A) Cell lysates were collected as described in Materials and Methods and immunoblotted with an anti-phospho-p53 (serine18, top panel) or anti-p53 (DO12, middle panel) antibody 18 hours after exposure to different concentrations of etoposide. Membranes were also stripped and immunoblotted with a β-tubulin antibody to confirm equal loading of lanes (bottom panel). (B) Cell lysates were collected 24 h after exposure to various doses of gamma irradiation, and lysates were collected and immunoblotted with an anti-phospho-p53 (serine18, top panel) or anti-p53 (DO12, middle panel) antibody. Membranes were also stripped and immunoblotted with a β-tubulin antibody to confirm equal loading of lanes (bottom panel). Results shown are representative of three independent experiments.
FIG. 8.
FIG. 8.
Diminished expression of p21WAF1 following DNA damage in myr-Akt1 salivary acinar cells. Total RNA was isolated from salivary acinar cells as described in Materials and Methods. (A) RNA was isolated from primary FVB or myr-Akt1 parotid acinar cells 18 h after treatment with etoposide, and the amount of p21WAF1 RNA was determined by quantitative RT-PCR. (B) Total cellular RNA was isolated from primary FVB or myr-Akt1 parotid acinar cells 18 h after treatment with etoposide, and the amount of Bax RNA was determined by quantitative RT-PCR. (C) Total cellular RNA was extracted from primary FVB or myr-Akt1 submandibular acinar cells 12 hours following gamma irradiation treatment and analyzed for p21WAF1 expression by quantitative RT-PCR. (D) Total cellular RNA was extracted from primary FVB or myr-Akt1 submandibular acinar cells 12 hours following gamma irradiation treatment and analyzed for Bax expression by quantitative RT-PCR. Bax and p21WAF1 CT values were normalized by the ribosomal protein S15 CT values and are expressed as the ratio of Bax or p21WAF1 expression to S15 expression. Asterisks designate significant differences (P ≤ 0.05) between myr-Akt1 and FVB, as calculated with a two-sample t test. In panel B, comparisons between myr-Akt1 and FVB cells untreated or treated with 100 μM etoposide did not reach significance (P, 0.07 and 0.13, respectively).
FIG. 9.
FIG. 9.
MDM2 expression is required for myr-Akt1-mediated suppression of apoptosis in salivary acinar cells. (A) Primary salivary acinar cells isolated from myr-Akt1 mice were transduced with recombinant adenoviruses encoding LacZ (Ad-LacZ) or a kinase-inactive mutant of Akt1 (Ad-KD-Akt1) at a multiplicity of infection of 150. Cell lysates were collected 24 h after transduction and immunoblotted with an antiphosphorylated MDM2serine163 (top panel), anti-MDM2 antibody (second panel), or anti-p53 (DO12, third panel). The membrane was stripped and immunoblotted with a β-tubulin antibody to confirm equal loading of lanes (bottom panel). (B) Primary salivary acinar cells isolated from myr-Akt1 mice were transfected with various control or MDM2-specific siRNA molecules. Cell lysates were collected 24 to 72 h after transfection and immunoblotted with an anti-MDM2 antibody (top panel) or anti-p53 (DO12, middle panel). Membranes were also stripped and immunoblotted with a β-tubulin antibody to confirm equal loading of lanes (bottom panel). (C) Primary salivary acinar cells isolated from myr-Akt1 mice were transfected with siRNA molecules as described for panel A for 30 h and then treated with 150 μM etoposide for 18 h. Activation of caspase 3 was determined as described in Materials and Methods and plotted as the increase relative to untreated parotid cells. The last lane depicts the induction of caspase 3 activity in FVB primary cells following treatment with 150 μM etoposide for 18 h. Data were collected from four independent experiments (mean ± standard error of the mean), and Student's t test P values, comparing two different treatment groups, were calculated with Microsoft Excel. Asterisks designate significant differences (P ≤ 0.05) between myr-Akt1 etoposide and individual siRNA molecules, as calculated with a two-sample t test. (D) Primary salivary acinar cells isolated from myr-Akt1 mice were transfected with various control or MDM2-specific siRNA molecules for 30 h followed by 150 μM etoposide for 18 h, as described for panel B. Cell lysates were collected and immunoblotted with a phosphorylation-specific anti-Chk1 antibody (serine345, top panel), phosphorylation-specific anti-p53 (serine18, third panel), or anti-total p53 (bottom panel). Membranes were also stripped and immunoblotted with a total Chk1 antibody to confirm equal loading of lanes (second panel). In lanes 6 and 7, primary salivary acinar cells isolated from myr-Akt1 mice were transfected with siRNA molecules targeting MDM2 for 48 h.

Similar articles

Cited by

References

    1. Abok, K., U. Brunk, B. Jung, and J. Ericsson. 1984. Morphologic and histochemical studies on the differing radiosensitivity of ductular and acinar cells of the rat submandibular gland. Virchows Arch. B Cell Pathol. Incl. Mol. Pathol. 45:443-460. - PubMed
    1. Alarcon-Vargas, D., and Z. Ronai. 2002. p53-Mdm2—the affair that never ends. Carcinogenesis 23:541-547. - PubMed
    1. Anderson, S. M., M. E. Reyland, S. Hunter, L. M. Deisher, K. A. Barzen, and D. O. Quissell. 1999. Etoposide-induced activation of c-jun N-terminal kinase (JNK) correlates with drug-induced apoptosis in salivary gland acinar cells. Cell Death Differ. 6:454-462. - PubMed
    1. Ashcroft, M., M. H. Kubbutat, and K. H. Vousden. 1999. Regulation of p53 function and stability by phosphorylation. Mol. Cell. Biol. 19:1751-1758. - PMC - PubMed
    1. Attardi, L. D., E. E. Reczek, C. Cosmas, E. G. Demicco, M. E. McCurrach, S. W. Lowe, and T. Jacks. 2000. PERP, an apoptosis-associated target of p53, is a novel member of the PMP-22/gas3 family. Genes Dev. 14:704-718. - PMC - PubMed

Publication types