. 2006 Nov;26(22):8607-22.
doi: 10.1128/MCB.00678-06. Epub 2006 Sep 18.

Activation of Saccharomyces cerevisiae HIS3 results in Gcn4p-dependent, SWI/SNF-dependent mobilization of nucleosomes over the entire gene

Affiliations

Activation of Saccharomyces cerevisiae HIS3 results in Gcn4p-dependent, SWI/SNF-dependent mobilization of nucleosomes over the entire gene

Yeonjung Kim et al. Mol Cell Biol. 2006 Nov.

Abstract

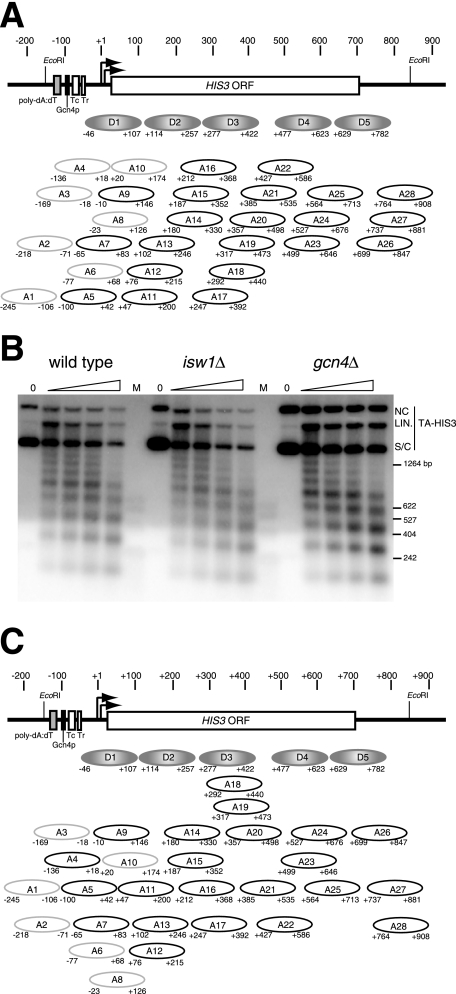
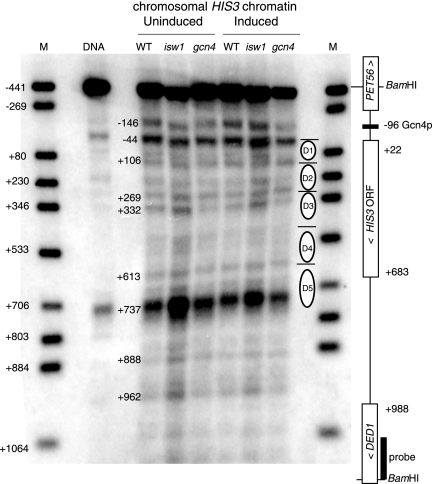
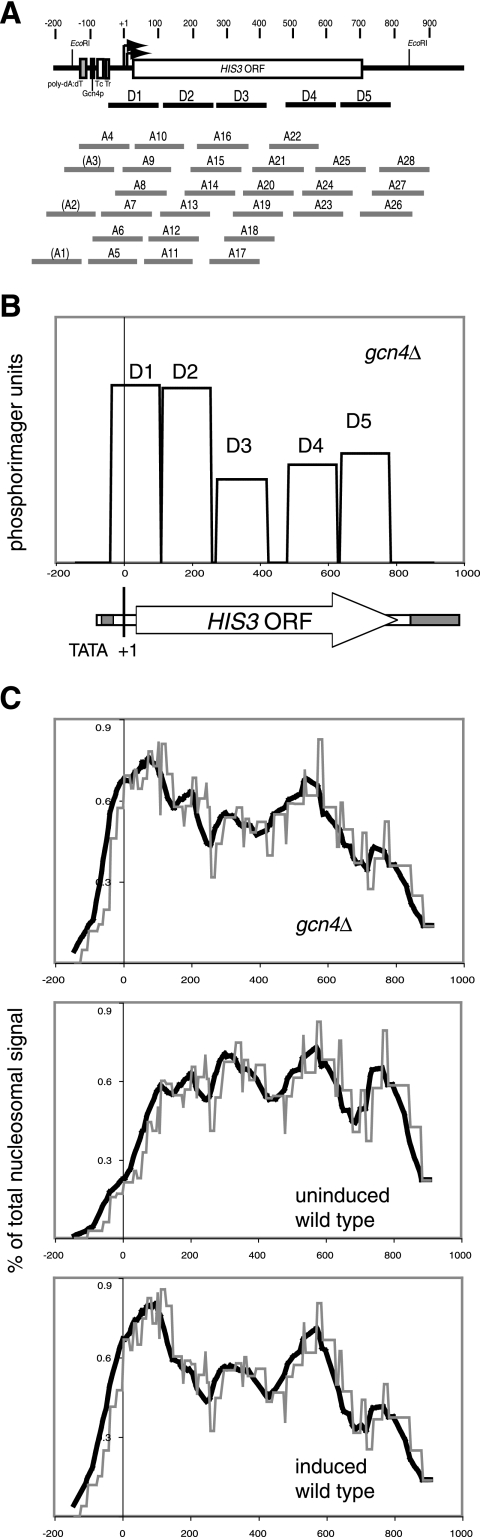
The effects of transcriptional activation on the chromatin structure of the Saccharomyces cerevisiae HIS3 gene were addressed by mapping the precise positions of nucleosomes in uninduced and induced chromatin. In the absence of the Gcn4p activator, the HIS3 gene is organized into a predominant nucleosomal array. In wild-type chromatin, this array is disrupted, and several alternative overlapping nucleosomal arrays are formed. The disruption of the predominant array also requires the SWI/SNF remodeling machine, indicating that the SWI/SNF complex plays an important role in nucleosome mobilization over the entire HIS3 gene. The Isw1 remodeling complex plays a more subtle role in determining nucleosome positions on HIS3, favoring positions different from those preferred by the SWI/SNF complex. Both the SWI/SNF and Isw1 complexes are constitutively present in HIS3 chromatin, although Isw1 tends to be excluded from the HIS3 promoter. Despite the apparent disorder of HIS3 chromatin generated by the formation of multiple nucleosomal arrays, nucleosome density profiles indicate that some long-range order is always present. We propose that Gcn4p stimulates nucleosome mobilization over the entire HIS3 gene by the SWI/SNF complex. We suggest that the net effect of interplay among remodeling machines at HIS3 is to create a highly dynamic chromatin structure.


Figures

FIG. 1.
FIG. 1.
Monomer extension mapping of nucleosomes positioned on HIS3 in TA-HIS3 chromatin purified from wild-type and gcn4Δ cells. (A) Map of the TRP1ARS1HIS3(TA-HIS3) plasmid (9). HIS3 was inserted at the EcoRI site of the TRP1ARS1 plasmid (37). TA-HIS3 has only 2,435 bp and contains no bacterial sequences. TRP1 is expressed at basal levels because the upstream activation sequence for TRP1 is not present in TRP1ARS1. The unique XbaI site used in the mapping experiments shown here is located in the TRP1 ORF. (B) Schematic diagram of the monomer extension method for mapping the positions of nucleosomes (41). The approach is to obtain DNA from nucleosome core particles (mononucleosomes or monomers) and use this as primer in a primer extension reaction; since both strands of nucleosomal DNA can act as primers, a single-stranded template must be used (otherwise two sets of extension products will be obtained). pGEM-TAHIS3 contains the entire TA-HIS3 sequence as an insert. Note that this method can resolve overlapping positions. (C) High-resolution monomer extension mapping of TA-HIS3 chromatin purified from uninduced (unind.) and induced wild-type cells and from gcn4Δ cells. Nucleosome positions were mapped with respect to the XbaI site in the TRP1 ORF (see panel A). The products of monomer extension reactions using nucleosomal DNA were analyzed with (+) or without (−) XbaI digestion in long sequencing gels. The purpose of monomer extension without XbaI cleavage was to identify bands resulting from premature termination by reverse transcriptase (lanes 4, 6, and 8). In the samples digested with XbaI, each band represents the distance of the downstream border of a nucleosome from the XbaI site. The bands which are quantitatively above background are labeled (nucleosomes D1 to D5 and A4 to A28); some are quantitatively so minor that they have been ignored. Some bands have been grouped (indicated by black bars at right) because they are less than 15 bp apart and so might represent incomplete trimming of the same nucleosome. The HIS3 transcription unit (with transcription start site at nucleotide +1) is shown at right, together with a series of gray ovals indicating the positions of the predominant (D) nucleosomes; these nucleosomes are present in wild-type and gcn4Δ chromatin but are clearly predominant in gcn4Δ chromatin. End-labeled markers: 100 bp ladder (New England Biolabs) (lane 1), a DdeI digest of λ DNA (lane 2), and a HinfI digest of λ DNA (lane 3). A phosphorimage is shown. The position information is summarized in Fig. 2A. (D) Scans of the monomer extension maps shown in panel C. The lanes corresponding to gcn4Δ chromatin (lane 9), induced wild-type chromatin (lane 7), and uninduced wild-type chromatin (lane 5) were scanned using a phosphorimager and normalized to the major peak at the top of the gel.
FIG. 2.
FIG. 2.
HIS3 chromatin is organized into overlapping nucleosomal arrays. (A) Arrays of positioned nucleosomes on HIS3. The precise positions of the nucleosomes mapped by monomer extension (as in Fig. 1) are given with downstream borders (relative to the HIS3 promoter) mapped with respect to the XbaI site in the TRP1 ORF (Fig. 1) and upstream borders mapped in independent experiments using other restriction enzymes (data not shown). HIS3 coordinates are given with respect to the transcription start sites at nucleotides +1 and +13 (33) (indicated by the arrows). The most important sequence elements in the HIS3 promoter are indicated by labeled boxes: the poly(dA-dT) element, the binding site for the Gcn4p activator, and the two TATA elements (TR and TC) (32). TA-HIS3 chromatin from gcn4Δ cells has a predominant array of nucleosomes over the HIS3 gene (Fig. 1), shown here as gray ovals labeled D1 to D5. This D array is not predominant in wild-type cells; the A nucleosomes, which overlap the D nucleosomes, are much more prominent in wild-type cells (A1 to A28). Quantitatively minor positions (A1 to A4, A6, A8, and A10) are shown as faint ovals. Nucleosomes on the HIS3 promoter elements (A1 to A3) were mapped in separate monomer extension experiments (data not shown). (B) Nucleosomal organization of the TA-HIS3 minichromosome in wild-type, isw1Δ, and gcn4Δ cells. Nuclei containing TA-HIS3 chromatin were digested with different amounts of MNase, and the resulting DNA fragments were separated in an agarose gel, which was then blotted and probed with TA-HIS3 DNA labeled by random priming. Some of the chromatin was resistant to digestion, perhaps due to clumping of nuclei or unlysed spheroplasts. The supercoiled (S/C), nicked circular (NC), and linear (LIN.) forms of TA-HIS3 DNA are indicated. (C) Possible arrangements of the nucleosomes shown in panel A into alternative arrays with predicted short repeat lengths (165 to 175 bp). Some nucleosomes could be alternatives for the same array (e.g., A18 and A19 could substitute for D3 and A3-A9-A14 could be replaced with A4-A10-A15). In this diagram, each nucleosome is depicted only once, but more arrays could be drawn if the same nucleosomes can occur in more than one array.
FIG. 3.
FIG. 3.
Nucleosome mobilization in HIS3 chromatin requires the Gcn4p activator and the SWI/SNF remodeling complex. (A) Monomer extension mapping of HIS3 in TA-HIS3 chromatin purified from induced wild-type, gcn4Δ, snf2Δ, and isw1Δ cells. Nucleosomes were mapped with respect to the XbaI site in the TRP1 ORF (see Fig. 1A); monomer extension without XbaI cleavage was to identify bands due to premature termination by the DNA polymerase. The bands corresponding to nucleosomes D1 to D5 and A4 to A28 are indicated (Fig. 2A shows a summary map). The asterisk indicates a nucleosome-free gap apparent in isw1Δ chromatin (see the text). Markers (lanes 1, 2, and 3) were as described in the legend for Fig. 1C. A phosphorimage is shown. (B) Phosphorimager scans of the monomer extension maps shown in panel A. The scans were normalized to the major peak at the top of the gel.
FIG. 4.
FIG. 4.
Analysis of the chromatin structure of chromosomal HIS3 by indirect end labeling. Nuclei from uninduced and induced wild-type (WT), isw1Δ, and gcn4Δ cells were digested with MNase. Purified DNA was digested with BamHI and electrophoresed in an agarose gel. A Southern blot was probed with the DED1 fragment indicated. M, marker corresponding to a mixture of restriction digests of the 1,767-bp BamHI HIS3 fragment obtained by PCR; the bands are labeled relative to the transcription start site of HIS3 at nucleotide +1. The positions of the nucleosomes in the D array identified by monomer extension (Fig. 1 and 2) are shown. Note that the major MNase cleavage sites identified by Losa et al. (16) were at nucleotides −156, −47, +107, +285, +608, +770, and +811. Those identified by Sekinger et al. (26) were at nucleotides −168, −48, +117, and +306 (only the 5′ half of HIS3 was mapped). These coordinates were adjusted to the first transcription start site at nucleotide +1 (33) for comparison.
FIG. 5.
FIG. 5.
SWI/SNF remodeling complex is constitutively present on the chromosomal HIS3 gene. Results from ChIP experiments are shown. (A) The SWI/SNF complex is present at the HIS3 promoter independently of the Gcn4p activator. The Snf2p ATPase subunit of the SWI/SNF complex was tagged with three FLAG epitopes (SNF2-FLAG) in otherwise wild-type cells and in gcn4Δ and isw1Δ cells; the wild type has no tag. IP, DNA immunoprecipitated using anti-FLAG antibody; mock, no antibody. The amounts of DNA in the immunoprecipitates were measured using multiplex PCR with end-labeled PCR primers. The HIS3 promoter was a 238-bp fragment, and the POL1 ORF internal control was 180 bp. Samples were as follows: U, uninduced; I, partially induced; and A, fully induced with 3-AT. Two input DNA dilutions (1 in 100 and 1 in 500) were measured. The percentages of DNA in the IPs relative to the input for the HIS3 promoter (black bars) and the POL1 ORF (gray bars) were measured using a phosphorimager and are graphed at right. The HIS3 promoter/POL1 ORF ratios are given above each pair of bars. For clarity, the quantification of the mock samples is not shown but, in all cases, the mock samples were 0.01% or less of input DNA. (B) Immunoprecipitation using an unrelated monoclonal antibody (anti-Myc 9E10) using the SNF2-FLAG strain described in panel A. (C) The SWI/SNF complex is present on the HIS3 ORF. The experiment was carried out as described for panel A, except that primers for the HIS3 ORF were used (yielding a 120-bp fragment), together with the POL1 primers (180 bp). (D) Gcn4p recruits more SWI/SNF complex to the ARG1 promoter. The same samples were used as in panels A and C, except that primers for the ARG1 promoter (which, like HIS3, is induced by 3-AT and regulated by Gcn4p) were used (yielding a 163-bp fragment), together with the POL1 primers (180 bp). (E) Gcn4p is present at the HIS3 promoter. A gcn4Δ strain was transformed with a centromeric (low-copy) plasmid with or without an inserted GCN4 gene carrying 13 myc tags encoded at the C terminus. ChIP experiments used anti-myc antibody (IP) or no antibody (mock). Different primers from those above were used for the HIS3 promoter, resulting in a 102-bp fragment; the control was a noncoding region of chromosome V (Int-V), yielding a 153-bp fragment. (F) Gcn4p does not recruit significant amounts of SWI/SNF to the HIS3 promoter. Strains with or without a point deletion in the binding site for Gcn4p in the HIS3 promoter (the his3-142 mutation [34]) were used. These strains expressed both Gcn4-myc and Snf2-FLAG. Top, ChIP using anti-Myc antibody to detect Gcn4-myc at the mutated and wild-type HIS3 promoter and at the ARG1 promoter as a control. Note the different scales for the HIS3 and ARG1 promoters. Bottom, ChIP using anti-FLAG antibody to detect Snf2-FLAG at the mutated and wild-type HIS3 promoter.
FIG. 6.
FIG. 6.
Isw1 remodeling complex is constitutively present on the chromosomal HIS3 gene but tends to be excluded from the HIS3 promoter. (A) The Isw1 complex tends to be excluded from the HIS3 promoter. Shown are results from ChIP experiments. The Isw1p ATPase subunit of the Isw1 complex was tagged with 3 FLAG epitopes (ISW1-FLAG) in otherwise wild-type cells and in gcn4Δ and snf2Δ cells; wild type has no tag. IP, DNA immunoprecipitated using anti-FLAG antibody; mock, no antibody. The amounts of DNA in the immunoprecipitates were measured using multiplex PCR with end-labeled PCR primers. The HIS3 promoter was a 238-bp fragment, and the POL1 ORF internal control was 180 bp. Samples were as follows: U, uninduced; I, partially induced; A, fully induced with 3-AT. Two input DNA dilutions (1 in 100 and 1 in 500) were measured. The percentage of DNA in the IPs relative to the input for the HIS3 promoter (black bars) and the POL1 ORF (gray bars) were measured using a phosphorimager and are graphed at the right. The HIS3 promoter/POL1 ORF ratios are given above each pair of bars. For clarity, quantification of the mock samples is not shown but, in all cases, the mock samples were less than 0.02% of the input DNA. (B) The Isw1 complex is present on the HIS3 ORF. The experiment was carried out as described for panel A, except that primers for the HIS3 ORF were used (yielding a 120-bp fragment), together with the POL1 primers (180 bp). The percentage of DNA in the IPs relative to the input for the HIS3 ORF (black bars) and the POL1 ORF (gray bars) were measured using a phosphorimager and are graphed at the right. The HIS3 ORF/POL1 ORF ratios are given above each pair of bars. For clarity, the quantification of the mock samples is not shown but, in all cases, the mock samples were less than 0.02% of the input DNA.
FIG. 7.
FIG. 7.
Nucleosome density profiles for the HIS3 gene reveal long-range order in HIS3 chromatin. (A) Schematic depiction of nucleosomal D and A arrays (from Fig. 2A). Each nucleosome was assumed to occupy 145 bp using the downstream border determined by monomer extension analysis (given in Fig. 2A). A1 to A3 were not included in the nucleosome density analysis because they are too close to the XbaI site to be detected by monomer extension using this enzyme and so are not present on the maps in Fig. 1. (B) Illustration of the predicted square waveform for the nucleosome density of an array of uniquely positioned nucleosomes. The D array in gcn4Δ chromatin is shown; the relative heights reflect the phosphorimager signals. In the idealized case of a unique array, the amplitudes would be identical. A scaled map of the HIS3 gene is shown below. (C) Calculated nucleosome density functions for uninduced and induced wild-type chromatin and gcn4Δ chromatin. The relative amounts of each nucleosome (D1 to D5 and A4 to A28) were determined from the phosphorimager scans (Fig. 1D). Each nucleosome was assigned a score equal to its phosphorimager signal after correction for background. The HIS3 gene was divided into 5-bp intervals; each nucleosome occupied 145 bp, corresponding to 29 bins of 5 bp each. The scores were integrated for each bin across the HIS3 gene to obtain nucleosome density functions, which were then normalized by calculating the integrated signal in each 5-bp bin as a percentage of the total integrated signal. This is plotted as a function of the HIS3 coordinate (with the first transcription start site as nucleotide +1). The profiles were smoothed using a 50-bp (10 bins) running average to simulate a lower resolution.
FIG. 8.
FIG. 8.
Working model for the transcriptional activation of HIS3 chromatin. The chromatin structure of the HIS3 gene expressed at basal levels (as in gcn4Δ chromatin) is characterized by a predominant nucleosomal array (D1 to D5), although A arrays are also present. In the presence of the Gcn4p activator, the activity of the SWI/SNF complex is stimulated, resulting in a net mobilization of nucleosomes from the D arrays to the A arrays. The Isw1 complex also affects the distribution of the nucleosomes, particularly at the 3′-end of HIS3. The inference is that HIS3 chromatin structure is highly dynamic. The nucleosomal flux created by the competing activities of the various remodeling complexes should facilitate access to the DNA for both transcript initiation and elongation complexes. Also note that we have previously shown that HIS3 nucleosomes apparently undergo a major conformational change requiring both Gcn4p and the SWI/SNF complex (9), which might increase the transparency of the chromatin still further.

Similar articles

Cited by

References

    1. Anderson, J. D., and J. Widom. 2001. Poly(dA-dT) promoter elements increase the equilibrium accessibility of nucleosomal DNA target sites. Mol. Cell. Biol. 21:3830-3839. - PMC - PubMed
    1. Cairns, B. R. 2005. Chromatin remodeling complexes: strength in diversity, precision through specialization. Curr. Top. Genet. Dev. 15:185-190. - PubMed
    1. Ercan, S., M. J. Carrozza, and J. L. Workman. 2004. Global nucleosome distribution and the regulation of transcription in yeast. Genome Biol. 5:243. - PMC - PubMed
    1. Eriksson, P. R., G. Mendiratta, N. B. McLaughlin, T. G. Wolfsberg, L. Mariño-Ramírez, T. A. Pompa, M. Jainerin, D. Landsman, C.-H. Shen, and D. J. Clark. 2005. Global regulation by the yeast Spt10 protein is mediated through chromatin structure and the histone upstream activating sequence elements. Mol. Cell. Biol. 25:9127-9137. - PMC - PubMed
    1. Hinnebusch, A. G., and K. Natarajan. 2002. Gcn4p, a master regulator of gene expression, is controlled at multiple levels by diverse signals of starvation and stress. Eukaryot. Cell 1:22-32. - PMC - PubMed

Publication types

MeSH terms

LinkOut - more resources