. 2006 Nov;26(22):8281-92.
doi: 10.1128/MCB.00941-06. Epub 2006 Sep 18.

Prostaglandin E2 induces fibroblast growth factor 9 via EP3-dependent protein kinase Cdelta and Elk-1 signaling

Affiliations

Prostaglandin E2 induces fibroblast growth factor 9 via EP3-dependent protein kinase Cdelta and Elk-1 signaling

Pei-Chin Chuang et al. Mol Cell Biol. 2006 Nov.

Abstract

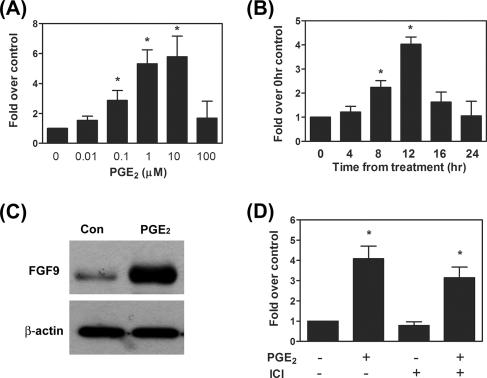
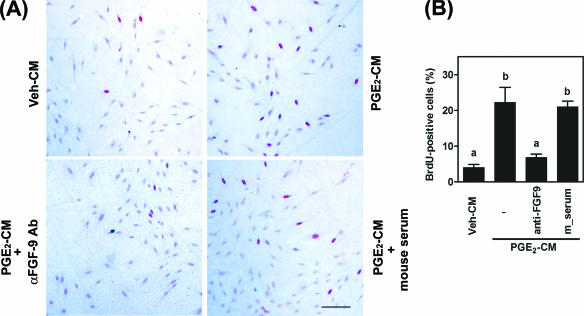
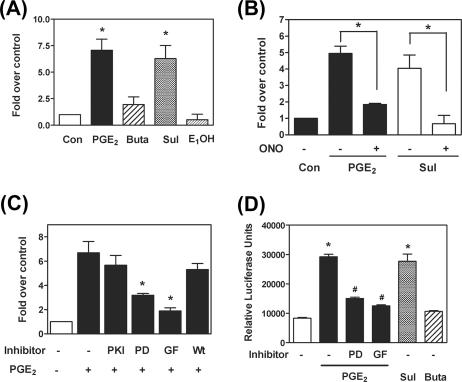
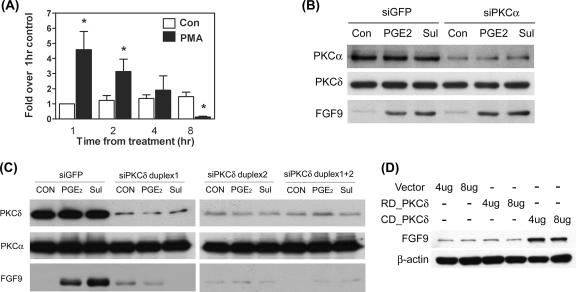
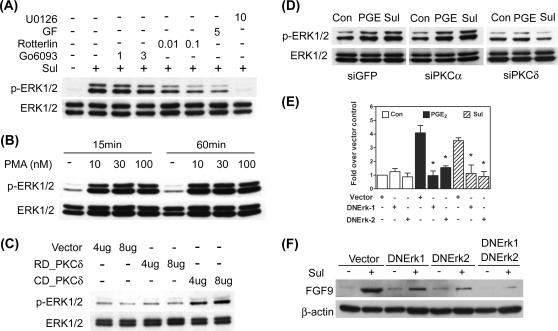
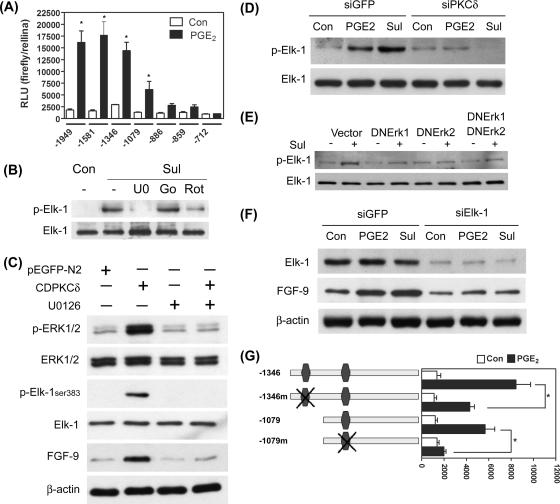
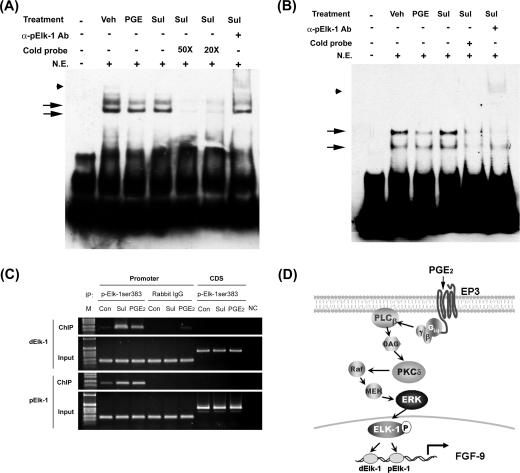
Fibroblast growth factor 9 (FGF-9) is a potent mitogen that controls the proper development of many tissues and organs. In contrast, aberrant expression of FGF-9 also results in the evolution of many human diseases, such as cancers and endometriosis. Despite its vital function being reported, the cellular and molecular mechanisms responsible for the regulation of FGF-9 expression are mostly unknown. We report here that prostaglandin E2 (PGE2) induces expression of FGF-9, which promotes endometriotic stromal cell proliferation, through the EP3 receptor-activated protein kinase Cdelta (PKCdelta) signaling pathway. Activation of PKCdelta leads to phosphorylation of ERK1/2, and the transcription factor Elk-1 thereby promotes transcription of FGF-9. Two Elk-1 cis-binding sites located at nucleotides -1324 to -1329 and -1046 to -1051 of the human FGF-9 promoter are identified as crucial for mediating PGE2 actions. Collectively, we demonstrate, for the first time, that PGE2 can directly induce FGF-9 expression via a novel signaling pathway involving EP3, PKCdelta, and a member of the ETS domain-containing transcription factor superfamily in primary human endometriotic stromal cells. Our findings may also provide a molecular framework for considering roles for PGE2 in FGF-9-related embryonic development and/or human diseases.


Figures

FIG. 1.
FIG. 1.
PGE2 induces FGF9 expression in endometriotic stromal cells. (A and B) Serum-starved stromal cells were treated with different doses (0.01 to 100 μM) of PGE2 for 12 h (n = 6) or with 1 μM PGE2 for different durations (n = 6). Cells were then subjected to mRNA isolation and FGF-9 transcript quantification by standard-curve QC-RT-PCR. Due to variations between individuals, data were normalized to those for the control group for each batch of cells. Data were analyzed by one-way ANOVA followed by Dunnett's test. Asterisks indicate significant differences compared to data for the control group (no PGE2 in panel A and time zero in panel B). (C) A representative Western blot shows upregulation of FGF-9 by PGE2. Serum-starved stromal cells were treated with vehicle or 1 μM PGE2 for 12 h, and equal amounts of total cell lysates were analyzed by Western blot analysis. This experiment was repeated six times using different batches of cells, and the results were similar. (D) Effect of ER antagonist ICI182,780 (10 μM) on expression of FGF9 mRNA induced by PGE2. Serum-starved cells were pretreated with or without ER antagonist ICI182,780 (10 μM) for 30 min followed by administration of vehicle or 1 μM PGE2, and expression levels of FGF9 mRNA were determined (n = 5). Data were analyzed by two-way ANOVA. Asterisks indicate significant differences between data for the control and PGE2-treated groups at P values of <0.05.
FIG. 2.
FIG. 2.
FGF-9 mediates PGE2-induced endometriotic-stromal-cell proliferation. (A) Representative pictures show DNA replication in endometriotic stromal cells. Serum-starved stromal cells were cultured in phenol red-free, serum-free DMEM/F12 and conditioned medium at a 1:1 ratio for 24 h. BrdU (100 μg/ml) was added to culture media 6 h before cells were fixed for BrdU staining. BrdU-positive cells (with red nuclei) were stained using a cell proliferation assay kit as described in Materials and Methods. Veh-CM, conditioned medium collected from ethanol-treated cells; PGE2-CM, conditioned medium collected from PGE2-treated cells; αFGF-9 Ab, monoclonal antibody against human FGF-9; mouse serum, unimmunized mouse serum. Scale bar, 50 μm. (B) FGF-9 mediates PGE2-induced endometriotic-stromal-cell proliferation. Data show means ± SEM for four independent experiments using different batches of cells. For each experiment, at least 500 cells were counted to quantify BrdU-positive cells. Different letters indicate significant differences at P values of <0.05.
FIG. 3.
FIG. 3.
PGE2-induced FGF-9 expression is mediated via the EP3 receptor-dependent signaling pathway. (A) Serum-starved stromal cells were treated with 1 μM PGE2, 10 μM butaprost (Buta), 10 μM sulprostone (Sul), or 10 μM PGE1-OH (E1OH) for 12 h. Data show means ± SEM for six independent experiments using different batches of cells. Asterisks denote significant differences from data for the control group (P < 0.05). (B) Serum-starved stroma cells were treated with 1 μM PGE2, 10 μM sulprostone in the presence or absence of ONO-AE3-240 (selective EP3 antagonist) for 12 h (n = 4). Asterisks indicate significant differences from data for the PGE2- or sulprostone-treated group (P < 0.05). (C) Serum-starved stromal cells were preincubated for 30 min with 25 μM PKI, 10 μM PD98059 (PD), 5 μM GF109203 (GF), or 1 μM wortmannin (Wt) and then treated with 1 μM PGE2 for 12 h (n = 6). Asterisks indicate significant differences from data for the PGE2-treated group (P < 0.05). (D) Ectopic endometriotic stromal cells were transfected with the FGF-9 promoter construct (nucleotides −1949 to +217) and treated with 1 μM PGE2 for 12 h in the presence or absence of different selective inhibitors, and then luciferase activity was analyzed. The promoter activities (relative light units [RLU]) were calculated by dividing firefly signal levels by Renilla signal levels (n = 6). Asterisks indicate significant differences from data for the control group, while # indicates significance compared to data for the PGE2-treated group (P < 0.05).
FIG. 4.
FIG. 4.
PKCδ is critical for PGE2-induced FGF-9 expression. (A) Serum-starved cells were treated with 30 nM PMA or vehicle for the indicated times, and expression levels of FGF-9 mRNA were determined by QC-RT-PCR. Data show means ± SEM for six independent experiments using different batches of cells. Asterisks indicate significant differences from data for the control group at each time point. (B) A representative picture shows the expression of FGF-9 protein after transient transfection with siPKCα. Stromal cells were transiently transfected with siPKCα siRNA or control siRNA as described in Materials and Methods. After transfection, serum-starved cells were treated with or without 1 μM PGE2 or 10 μM sulprostone (Sul) for 12 h. Equal amounts of total cell lysates were analyzed by SDS-PAGE and immunoblotted with antibodies against PKCα (upper panel), PKCδ (middle panel), and FGF-9 (lower panel). (C) A representative picture shows the expression of FGF-9 protein after transient transfection with siPKCδ. Stromal cells were transiently transfected with siPKCδ duplex 1, siPKCδ duplex 2, siPKCδ duplex 1 plus duplex 2, or control siRNA (siGFP) as described in Materials and Methods. After transfection, serum-starved cells were treated with or without 1 μM PGE2 or 10 μM sulprostone for 12 h. Equal amounts of total cell lysates were analyzed by SDS-PAGE and immunoblotted with antibodies against PKCα (upper panel), PKCδ (middle panel), and FGF-9 (lower panel). (D) Stromal cells were transiently transfected with 4 μg or 8 μg of control vector pEGFP-N2 only (vector), the catalytic subunit of PKCδ (CD_PKCδ), or the regulatory subunit of PKCδ (RD_PKCδ) for 12 h. Equal amounts of cell lysates were analyzed by SDS-PAGE and immunoblotted with anti-FGF-9 or anti-β-actin antibodies, sequentially. These experiments were repeated four times using different batches of cells, and the results were similar.
FIG. 5.
FIG. 5.
PGE2-induced FGF-9 expression is mediated by ERK1/2. (A) A representative picture shows the phosphorylation of ERK1/2 after EP3 agonist stimulation. Serum-starved cells were treated with 10 μM sulprostone (Sul) in the presence or absence of different concentrations of rottlerin, Gö6976, or GF109203 (GF) for 15 min (n = 5). Equal amounts of lysates were analyzed by SDS-PAGE and immunoblotted with antibodies against p-ERK1/2 (upper panel) and total ERK1/2 (lower panel). (B) Serum-starved cells were treated with different doses of PMA (10 to 100 nM) for 15 or 60 min. Equal amounts of lysates were analyzed by SDS-PAGE and immunoblotted with antibodies against p-ERK1/2 and total ERK1/2. (C) Serum-starved cells were transiently transfected with 4 μg or 8 μg of control vector (vector), the catalytic subunit of PKCδ (CD_PKCδ), or the regulatory subunit of PKCδ (RD_PKCδ), and levels of phosphorylated ERK1/2 and total ERK1/2 were determined as described above. (D) Serum-starved cells were treated as described in the legend to Fig. 4A. Equal amounts of lysates were analyzed by SDS-PAGE and immunoblotted with antibodies against p-ERK1/2 and total ERK1/2. (E) Stromal cells were transiently transfected with 2 μg of dominant-negative ERK1 or ERK2 (DNERK1 or DNERK2, respectively) or control vector and incubated for 48 h. Serum-starved cells were then treated with 1 μM PGE2 or 10 μM sulprostone (Sul) for another 12 h. Concentrations of FGF-9 transcripts were quantified by standard-curve QC-RT-PCR (n = 5). Asterisks indicate significant differences from data for the PGE2- and sulprostone-treated groups (P < 0.05). (F) Stromal cells were transiently transfected with control vector (Vector), dominant-negative ERK1 or ERK2 (DNERK1 or DNERK2, respectively), or dominant-negative ERK1 and ERK2 in combination (DNERK1+DNERK2) as described above. Equal amounts of lysates were analyzed by SDS-PAGE and immunoblotted with antibodies against FGF-9 (upper panel) and β-actin (lower panel). All the experiments were repeated at least four times, and the results were similar.
FIG. 6.
FIG. 6.
Elk-1 is the downstream effector of PKCδ in PGE2-induced FGF-9 expression. (A) Serial deletion constructs of the FGF-9 promoter were transiently transfected into endometriotic stromal cells and stimulated with or without 1 μM PGE2 for 12 h. The promoter activities (relative light units [RLU]) were calculated by dividing firefly signal levels by Renilla signal levels. Asterisks denote significant differences between data for the control and PGE2-treated groups transfected with the same promoter construct (P < 0.05). (B) A representative picture shows that sulprostone-induced Elk-1 phosphorylation can be abolished by selective PKCδ and ERK inhibitors. Serum-starved cells were preincubated for 30 min with 10 μM U0126 (U0), 1 μM Gö6976 (Go), or 0.1 μM rottlerin (Rot) and then treated with 10 μM sulprostone (Sul) for 15 min. Equal amounts of lysates were analyzed by SDS-PAGE and immunoblotted with antibodies against phospho-Elk-1 and total Elk-1. (C) A representative picture shows that ERK mediates PKCδ-induced Elk-1 phosphorylation and FGF-9 expression. Serum-starved cells were preincubated for 30 min with or without 10 μM U0126 and transiently transfected with 4 μg of the catalytic domain of PKCδ plasmid or empty vector (pEGFP-N2) for 12 h. Equal amounts of lysates were analyzed by SDS-PAGE and immunoblotted with antibodies as indicated above. (D) Serum-starved stromal cells were treated as described in the legend to Fig. 4B. Equal amounts of lysates were analyzed by SDS-PAGE and immunoblotted with antibodies against phospho-Elk-1 and total Elk-1. (E) Stromal cells were transiently transfected with control vector, dominant-negative ERK1 (DNERK1), dominant-negative ERK2 (DNERK2), or dominant-negative ERK1 and ERK2 in combination and incubated for 48 h. After serum starvation, cells were treated with 10 μM sulprostone for 15 min. Equal amounts of lysates were analyzed by SDS-PAGE and immunoblotted with antibodies against phospho-Elk-1 and total Elk-1. (F) Stromal cells were transiently transfected with siElk-1 siRNA or control siRNA as described in Materials and Methods. After serum starvation, cells were treated with or without 1 μM PGE2 or 10 μM sulprostone for 12 h. Equal amounts of total cell lysates were analyzed by SDS-PAGE and immunoblotted with antibodies against total Elk-1 (upper panel), FGF-9 (middle panel), and β-actin (lower panel). (G) Schematic drawing of two constructs of the human FGF-9 promoter (nucleotides −1346 to +217 and −1079 to +217) with annotated Elk-1 binding sites. The wild-type (−1346 and −1079) and site-mutated (−1346m and −1079m, respectively) Elk-1 sites are indicated (left panel). The promoter activities (relative light units [RLU]) were calculated by dividing firefly signal levels by Renilla signal levels (right panel). Asterisks denote significant differences between data for the wild type and the site-mutated constructs treated with 1 μM PGE2 (P < 0.05). All the experiments were repeated for three to six times with different batches of cells, and the results were similar within each experiment.
FIG. 7.
FIG. 7.
Binding of Elk-1 to the fgf-9 promoter is enhanced after PGE2 treatment. (A and B) Representative EMSA pictures show in vitro binding of Elk-1 to the two predicted Elk-1 elements in the fgf-9 promoter. Nuclear extract of vehicle, PGE2, or sulprostone-treated stromal cells was incubated with biotin-labeled probe containing the dElk-1 (A) or pElk-1 (B) element of the fgf-9 gene promoter in the presence or absence of excess cold probe. Arrows indicate the DNA/protein complex. Anti-phospho-Elk-1 antibody was added to detect the supershift of the protein/DNA complex (arrowhead). Sul, sulprostone. (C) Chromatin immunoprecipitation assay demonstrates in vivo binding of Elk-1 to the predicted dElk-1 and pElk-1 sites. Immunoprecipitated DNA using anti-phospho-Elk-1 antibody, control rabbit immunoglobulin G (ChIP), or genomic DNA (input) was subjected to PCR amplification using primers specific for dElk-1, pElk-1 (promoter), or the downstream coding region (CDS). (D) A schematic drawing shows the signal transduction pathway mediating PGE2-induced fgf-9 gene transcription. See the text for details.

Similar articles

Cited by

References

    1. Anderson, G. D., S. D. Hauser, K. L. McGarity, M. E. Bremer, P. C. Isakson, and S. A. Gregory. 1996. Selective inhibition of cyclooxygenase (COX)-2 reverses inflammation and expression of COX-2 and interleukin 6 in rat adjuvant arthritis. J. Clin. Investig. 97:2672-2679. - PMC - PubMed
    1. Breyer, R. M., C. K. Bagdassarian, S. A. Myers, and M. D. Breyer. 2001. Prostanoid receptors: subtypes and signaling. Annu. Rev. Pharmacol. Toxicol. 41:661-690. - PubMed
    1. Castelao, J. E., R. D. Bart III, C. A. DiPerna, E. M. Sievers, and R. M. Bremner. 2003. Lung cancer and cyclooxygenase-2. Ann. Thorac. Surg. 76:1327-1335. - PubMed
    1. Castellone, M. D., H. Teramoto, B. O. Williams, K. M. Druey, and J. S. Gutkind. 2005. Prostaglandin E2 promotes colon cancer cell growth through a Gs-axin-beta-catenin signaling axis. Science 310:1504-1510. - PubMed
    1. Chen, K. F., Y. Y. Lai, H. S. Sun, and S. J. Tsai. 2005. Transcriptional repression of human cad gene by hypoxia inducible factor-1alpha. Nucleic Acids Res. 33:5190-5198. - PMC - PubMed

Publication types

MeSH terms

LinkOut - more resources