. 2006 Sep 25;174(7):915-21.
doi: 10.1083/jcb.200604016. Epub 2006 Sep 18.

Structural and functional features and significance of the physical linkage between ER and mitochondria

Affiliations

Structural and functional features and significance of the physical linkage between ER and mitochondria

György Csordás et al. J Cell Biol. .

Abstract

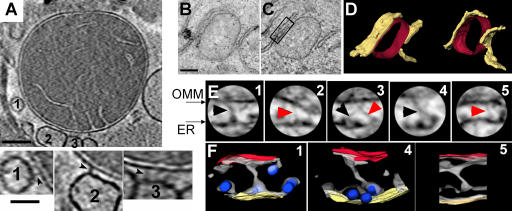
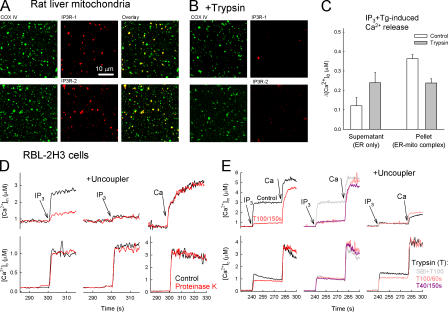
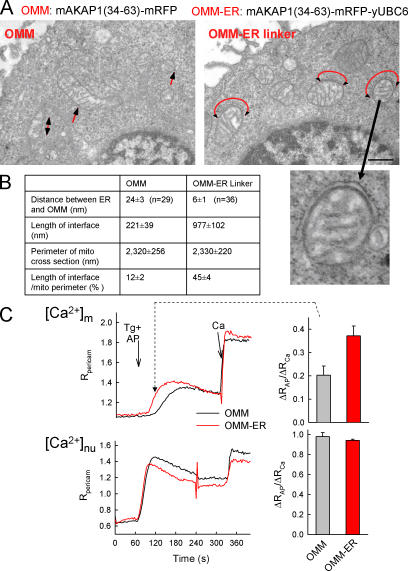
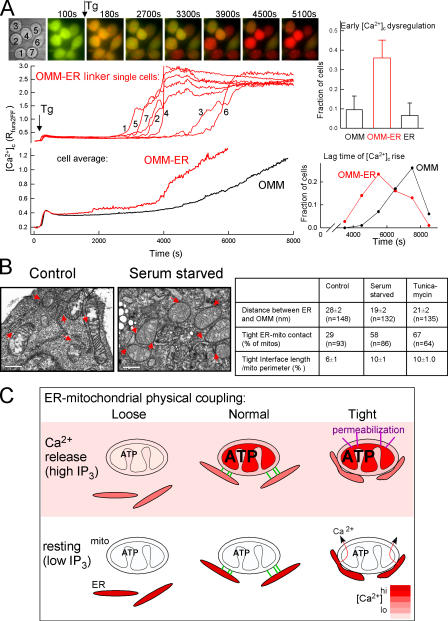
The role of mitochondria in cell metabolism and survival is controlled by calcium signals that are commonly transmitted at the close associations between mitochondria and endoplasmic reticulum (ER). However, the physical linkage of the ER-mitochondria interface and its relevance for cell function remains elusive. We show by electron tomography that ER and mitochondria are adjoined by tethers that are approximately 10 nm at the smooth ER and approximately 25 nm at the rough ER. Limited proteolysis separates ER from mitochondria, whereas expression of a short "synthetic linker" (<5 nm) leads to tightening of the associations. Although normal connections are necessary and sufficient for proper propagation of ER-derived calcium signals to the mitochondria, tightened connections, synthetic or naturally observed under apoptosis-inducing conditions, make mitochondria prone to Ca2+ overloading and ensuing permeability transition. These results reveal an unexpected dependence of cell function and survival on the maintenance of proper spacing between the ER and mitochondria.


Figures

Figure 1.
Figure 1.
Tethering structures between ER and mitochondria visualized by ET. (A, top) Slice (2 nm thick) from tomogram of a frozen-hydrated rat-liver mitochondrion (700-nm diameter), showing several attached putative ER vesicles. Bar, 100 nm. (bottom) Higher magnification (2×) slices through vesicles 1–3 showing tethers (arrowheads). Bar, 50 nm. (B) Micrograph of a DT40 TKO cell (200-nm-thick plastic section) showing ER flanking a mitochondrion. Bar, 250 nm. (C) Slice (3 nm thick) from tomogram of this field. (D) Surface model of ER (yellow) and OMM (red). (E) Subfields (130-nm diameter) from ER–mitochondria interface regions (1–3 are from boxed region in D) with tethers indicated by arrowheads (black arrowheads indicate tethers that terminate on ribosomes). (F) 3D models of three subregions in E, showing isodensity surfaces that best visualize the tethers (gray), membrane surfaces (OMM, red; ER, yellow), and ribosomes (blue ellipsoids). The resolution is ∼8 nm in the z (vertical or section thickness) direction.
Figure 2.
Figure 2.
Limited proteolysis loosens the structural and functional association of the IP3R with mitochondria. (A and B) Confocal images showing the distribution of IP3Rs (red) and the cytochrome c oxidase (green) and their colocalization (overlay, yellow) in a rat-liver mitochondrial fraction attached to coverslips. (B) Trypsin (40 μg/ml; 150 s) was added before attachment to the coverslips (n = 3). (C) ER Ca2+ storage in naive and trypsin-pretreated rat-liver mitochondrial fraction. In suspensions of the particles, the capacity of the ER Ca2+ store was determined as the sum of the extravesicular [Ca2+] ([Ca2+]o) increases caused by sequentially added IP3 and Tg in the 10,000-g supernatants (ER-only fraction) and pellets (ER–mitochondria complex) after trypsinization (40 μg/ml; 150 s) in the presence (control) and absence of SBI (mean ± SEM; n = 10). (D and E) Effect of proteinase K and trypsin on the IP3-induced [Ca2+]c and [Ca2+]m increase in suspensions of permeabilized RBL-2H3 cells. (D) Control (black) and proteinase K–pretreated cells (red) in the absence (left) or presence (middle) of uncoupler (2 μM carbonyl cyanide p-trifluoromethoxyphenylhydrazone + 5 μg/ml oligomycin). (right) [Ca2+]m rise evoked by a 10 μM CaCl2 pulse (Ca; bulk [Ca2+]c increase, ∼3 μM). To prevent the uptake of added Ca2+ by the ER, 2 μM Tg was added 5 s before stimulus. (E) 100 μg/ml trypsin for 150 s (left, red) or 60 s (middle, pink). 40 μg/ml trypsin for 150 s (middle) in the absence (purple) or presence (gray) of 250 μg/ml SBI. (right) Effect of trypsin in the presence of uncoupler.
Figure 3.
Figure 3.
Enhancement of the ER–mitochondria association and Ca2+ coupling by a synthetic linker protein. (A) Electron micrographs of RBL-2H3 cells expressing the mAKAP1(34–63)-mRFP-yUBC6 or mAKAP1(34–63)-mRFP with red arrows showing the ER–mitochondria contacts. (B) Dimensions of the ER–mitochondria interface in each condition. (C) [Ca2+]m and nuclear [Ca2+] ([Ca2+]nu) responses to submaximal doses of adenophostin (AP) recorded using pericam in cells transfected with OMM-mRFP (black) or OMM–ER linker-mRFP (red). Adenophostin evokes gradual Ca2+ liberation through IP3Rs and a [Ca2+]m increase characterized with a gradual slow phase when the sarcoplasmic/endoplasmic reticulum calcium ATPase pumps are blocked (Csordas and Hajnoczky, 2001). As a reference, a 20-μM CaCl2 pulse (Ca) was applied. (right) [Ca2+]c and [Ca2+]m increases 60 s after adenophostin stimulation. Data are normalized to the response evoked by Ca (P > 0.01; n = 15–16). Error bars indicate SEM.
Figure 4.
Figure 4.
Relevance of the tight ER–mitochondria association for cell survival. (A) Sensitization to Tg-induced Ca2+ overloading and mitochondrial membrane permeabilization in RBL-2H3 cells expressing either the OMM–ER linker or OMM- or ER-only targeted control. (left) Overlaid fura2FF fluorescence images recorded at 340 nm (red)/380 nm (green) excitation (56 × 60 μm area) and the fura2FF ratio graphs for individual cells (middle) and for the mean (bottom) show two sequential [Ca2+]c elevations evoked by 2 μM Tg in OMM–ER linker-mRFP (red) and OMM-mRFP (black) overexpressing cells (n = 74 and 100, respectively). (right) Lag time distributions for the steep second [Ca2+]c rise in the experiment shown in the left (bottom) and the fraction of cells exhibiting a [Ca2+]c rise above the first peak at 30 min of stimulation for the series of experiments (n = 3; top). (B) EM images (red arrowheads depicting the close contacts) and measurements of the ER–mitochondria interface in cells exposed to proapoptotic conditions (0% serum starvation and 10 μg/ml tunicamycin). (C) Dependence of mitochondrial function on the gap width between ER and mitochondria. In the scheme, the effects on [Ca2+]m, ATP production, and membrane permeabilization are shown for the normal (middle), loose (left), and tight (right) variations in ER–mitochondria physical coupling. Error bars indicate SEM.

References

    1. Bernardi, P. 1999. Mitochondrial transport of cations: channels, exchangers, and permeability transition. Physiol. Rev. 79:1127–1155. - PubMed
    1. Bird, G.S., M. Takahashi, K. Tanzawa, and J.W. Putney Jr. 1999. Adenophostin A induces spatially restricted calcium signaling in Xenopus laevis oocytes. J. Biol. Chem. 274:20643–20649. - PubMed
    1. Brough, D., M.J. Schell, and R.F. Irvine. 2005. Agonist-induced regulation of mitochondrial and endoplasmic reticulum motility. Biochem. J. 392:291–297. - PMC - PubMed
    1. Collins, T.J., M.J. Berridge, P. Lipp, and M.D. Bootman. 2002. Mitochondria are morphologically and functionally heterogeneous within cells. EMBO J. 21:1616–1627. - PMC - PubMed
    1. Csordas, G., and G. Hajnoczky. 2001. Sorting of calcium signals at the junctions of endoplasmic reticulum and mitochondria. Cell Calcium. 29:249–262. - PubMed

Publication types