. 2006 Sep 25;174(7):985-96.
doi: 10.1083/jcb.200604069. Epub 2006 Sep 18.

Cytopathic effects of the cytomegalovirus-encoded apoptosis inhibitory protein vMIA

Affiliations

Cytopathic effects of the cytomegalovirus-encoded apoptosis inhibitory protein vMIA

Delphine Poncet et al. J Cell Biol. .

Abstract

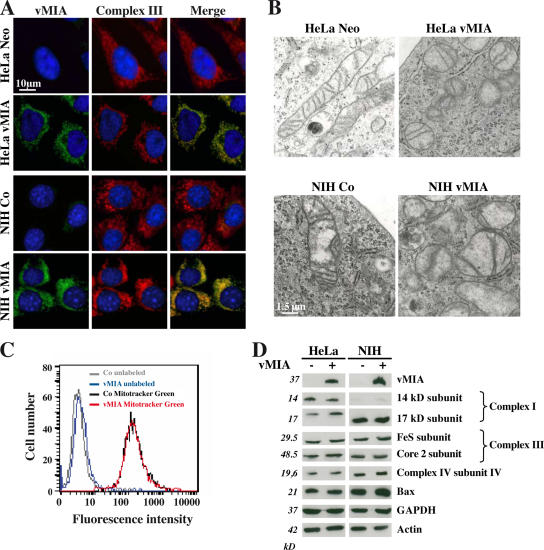
Replication of human cytomegalovirus (CMV) requires the expression of the viral mitochondria-localized inhibitor of apoptosis (vMIA). vMIA inhibits apoptosis by recruiting Bax to mitochondria, resulting in its neutralization. We show that vMIA decreases cell size, reduces actin polymerization, and induces cell rounding. As compared with vMIA-expressing CMV, vMIA-deficient CMV, which replicates in fibroblasts expressing the adenoviral apoptosis suppressor E1B19K, induces less cytopathic effects. These vMIA effects can be separated from its cell death-inhibitory function because vMIA modulates cellular morphology in Bax-deficient cells. Expression of vMIA coincided with a reduction in the cellular adenosine triphosphate (ATP) level. vMIA selectively inhibited one component of the ATP synthasome, namely, the mitochondrial phosphate carrier. Exposure of cells to inhibitors of oxidative phosphorylation produced similar effects, such as an ATP level reduced by 30%, smaller cell size, and deficient actin polymerization. Similarly, knockdown of the phosphate carrier reduced cell size. Our data suggest that the cytopathic effect of CMV can be explained by vMIA effects on mitochondrial bioenergetics.


Figures

Figure 1.
Figure 1.
Mitochondrial morphological changes in cells expressing vMIA. (A) Immunofluorescence stainings. The expression and localization of vMIA were analyzed by costaining of the Myc tag of vMIA and the core 2 subunit of the complex III on HeLa and NIH3T3 cells stably expressing vMIA (HeLa vMIA and NIH vMIA), as well as control cells (HeLa Neo and NIH Co). (B) Transmission electron microscopy of mitochondrion-rich areas from the indicated cell lines. Note the rounding and the disorganization of cristae in vMIA-expressing mitochondria. (C) Quantification of mitochondrial mass by staining with MitoTracker green. After staining, cells were subjected to flow cytometric analyses. (D) Immunoblotting of respiratory chain subunits. Lysates from the different cell lines were subjected to the immunochemical quantitation of the indicated proteins. GAPDH and actin were probed to control for equal loading.
Figure 2.
Figure 2.
Effect of vMIA on cell size and the actin cytoskeleton. (A) Cell size of vMIA-expressing HeLa and NIH cells compared with control cells was determined by cytofluorometric analyses of the FSC. (B) Plasma membrane surface of vMIA-expressing cells. The binding of the green fluorescent dye PKH2-GL to the lipids of the cytoplasmic membrane was measured by cytofluorometry and the mean channel was plotted. n = 4. Asterisks represent P = 0.05, t test. (C) Surface of adherence of vMIA-expressing cells. Cells were stained with CellTracker green, photographed, and subjected to morphometric analyses of the mean surface of adhesion. n = 2,200 cells. (D) Actin cytoskeleton in vMIA-expressing cells. Control or vMIA-expressing HeLa and NIH cells were stained with phalloidin–Alexa Fluor 568 and Hoechst 33342 to visualize actin and chromatin, respectively. Note the absence of stress fibers and the diminution of the actin cortex induced by vMIA. (E) Adhesion kinetics of vMIA-expressing cells. Cells were trypsinized and allowed to adhere during the indicated period of time, and the percentage of adherent cells was determined by phase-contrast microscopy. n = 3. (F) Influence of vMIA on wound healing. The cell monolayer was wounded, and the movement of cells filling the gap was recorded at different times. The mean wound size is plotted. n = 4. Error bars represent the mean ± the SD.
Figure 3.
Figure 3.
vMIA-induced morphological changes in Bax-negative cells. (A) Effect of the Bax knockdown. HeLa Neo or HeLa vMIA cells were transfected with a control siRNA or either of two Bax-specific siRNAs, and the down-regulation of Bax was confirmed by immunoblotting 3 d after transfection. Bax-depleted or control cells were subjected to FACS analysis and the mean size (FSC) was determined. n = 3. Asterisks represent P > 0.05, t test. (B) Effect of the Bak knockdown. HeLa vMIA cells were depleted from Bak with two different siRNAs, and the impact of this manipulation was determined on cell size 2 d after transfection. (C) Impact of vMIA on Bax-deficient HCT116 cells. HCT116 Bax+/− and Bax−/− cells were transfected either with vMIA or Myc control vectors, and cell size was measured by FACS analysis. n = 3. (D) vMIA-induced fragmentation of the mitochondrial network in the absence of Bax. The mitochondrial fragmentation was determined by immunofluorescence microscopy after immunostaining of the vMIA Myc tag and the core 2 subunit of complex III in HCT116 Bax−/− cells. Error bars represent the mean ± the SD.
Figure 4.
Figure 4.
Effect of vMIA on mitochondrial respiration. (A) Respiratory control in BJAB cells transfected either with vMIA or the Myc control vector (Myc). Cells were permeabilized, placed in an oxygen electrode, and subjected to the sequential addition of the indicated agents. Note that ADP does not stimulate the oxygen consumption of vMIA-expressing cells, although it does so in control cells. n = 3. Similar data were obtained in HeLa cells (not depicted). (B) F1F0ATP synthase activity in vMIA-expressing cells. The ATP synthase activity of isolated mitochondria was determined by spectrophotometry, and the abundance of the α subunit was determined by immunoblotting (top). Error bars represent the mean ± the SD. (C) ANT activity in vMIA-expressing mitochondria. Increasing amounts of ADP were added to isolated mitochondria of control and vMIA cells, and the translocase activity of ANT was evaluated as proportional to the NADP+ reduction measured by luminescence assay. Data were fitted with the Michaelis–Menten equation under Kaleidagraph software (Synergy Software). (top) Immunoblot determinations of ANT protein levels. (D) Resting mitochondrial ATP levels and ANT activity in HeLa cells. mtLuc-transfected cells were selectively permeabilized with 25 μM digitonin in an intracellular-like solution that leaves mitochondrial membranes intact. The luciferase activity was monitored to measure the concentration of ATP in the mitochondrial matrix. Before each measurement, cells were pretreated with 5 μM oligomycin for 10 min. The mean ± the SEM of 25 traces are shown in control (black) and vMIA stably transfected (gray) HeLa cells. The ATP/ADP exchange activity of ANT is represented by the kinetics of ATP level after the addition of 500 μM ATP. (E) Phosphate uptake in vMIA-expressing mitochondria compared with control mitochondria, as determined in Materials and methods. Immunoblots show the determination of PiC protein level. (F) Kinetics of phosphate uptake into mitochondria from vMIA-expressing and control HeLa cells. Mitochondrial ATP levels were measured as in D. To ensure maximal activity of the F1F0ATP synthase, 1 mM ADP and 100 μM ATP were used in the intracellular buffer. Representative traces from three separate experiments are shown.
Figure 5.
Figure 5.
Metabolic effects of vMIA. (A) Basic cellular ATP levels in control and vMIA-expressing cell lines. 100% values are set for controls. Error bars represent the mean ± the SD. n = 6. (B) Basic cellular ATP levels in Myc (control), vMIA wt, and vMIAΔ23-34–transiently expressing cells. 100% values are set for controls. Representative results are presented. (C) Glucose (left) and lactate concentrations (right) in the medium of vMIA-expressing HeLa cells as compared with normal controls. The measurements were performed in three separate experiments. (D) Effects of vMIA on the phosphorylation of AMPK and p70S6K. Immunoblots were probed with antibodies recognizing the indicated phosphoproteins or the proteins as such.
Figure 6.
Figure 6.
Effect of ATP depletion on cell size and the actin cytoskeleton. (A) Impact of ATP depletion on cell size. ATP levels and cell size were determined after 48-h treatment of NIH control cells with increasing doses of oligomycin. Similar results were obtained for HeLa cells (not depicted). (B) Impact of ATP depletion on the actin cytoskeleton. NIH control cells were cultured in the absence or presence of 10 nM oligomycin for 2 d, and then stained to visualize actin and chromatin. Note the reduction of stress fibers, cell size, and adhesion surface. (C) Impact of ATP on wound healing. The NIH control monolayer was wounded, and the size of the gap was evaluated at different times. n = 3. (D) Impact of complex I and II inhibition on cell size. Control NIH cells were treated with 10 nM rotenone or 1 mM TTFA for 48 h, and the cellular ATP level and cell size were measured. (E and F) Effect of the depletion of the mitochondrial PiC on cell size. The phosphate carrier was depleted using two distinct siRNAs, and the abundance of the mRNA transcript and the protein levels (E) or cell size (F) were assessed 2 d after transfection. Asterisks indicate significant effects on cell size (n = 3) in phosphate carrier–depleted cells, as compared with control transfectants. Error bars represent the mean ± the SD.
Figure 7.
Figure 7.
vMIA-dependent cytopathic effects of CMV. (A–D) ECE of CMV-encoded vMIA. Human MRC5E1B19K fibroblasts were infected with wild-type (WT) CMV or a vMIA-deficient CMV (ΔvMIA) for the indicated period (28 h in A, B, and D), followed by staining of actin (A, B, and D) and the viral proteins IEA (A) or vMIA (B and D). The percentage of cells exhibiting ECE was determined among the cells expressing IEA or vMIA (C). Confocal immunofluorescence (YX/planar and XZ/vertical views) of wild-type CMV-infected cells was performed, and the three stages of vMIA expression are shown in D; without mitochondrial fragmentation and cell rounding (step 1), with mitochondrial fragmentation and without rounding (step 2), and with fragmentation and rounding (step 3), representing ∼10, ∼2, and ∼88% of the cells, respectively. (E and F) LCE of wild-type (WT) and vMIA-deficient (ΔvMIA) CMV. Human MRC5E1B19K fibroblasts were infected with WT or ΔvMIA CMV for the indicated period (5 d in E; 4–7 d in F), followed by staining of actin and the viral protein EA. Arrows indicate cells with a marked cytopathic effect, namely, granulation and near-to-completed disappearance of the actin cytoskeleton (E). The percentage of cells expressing EA was quantified and the percentage of cells exhibiting LCE was determined among the cells expressing EA (F). Typical results representative of three independent experiments are shown. Error bars represent the mean ± the SD.

Similar articles

Cited by

References

    1. Arnoult, D., L.M. Bartle, A. Skaletskaya, D. Poncet, N. Zamzami, P.U. Park, J. Sharpe, R.J. Youle, and V.S. Goldmacher. 2004. Cytomegalovirus cell death suppressor vMIA blocks Bax- but not Bak-mediated apoptosis by binding and sequestering Bax at mitochondria. Proc. Natl. Acad. Sci. USA. 101:7988–7989. - PMC - PubMed
    1. Atkinson, S.J., M.A. Hosford, and B.A. Molitoris. 2004. Mechanism of actin polymerization in cellular ATP depletion. J. Biol. Chem. 279:5194–5199. - PubMed
    1. Belzacq, A.S., C. El Hamel, H.L.A. Vieira, I. Cohen, D. Haouzi, D. Metivier, P. Marchetti, V. Goldmacher, C. Brenner, and G. Kroemer. 2001. The adenine nucleotide translocator mediates the mitochondrial membrane permeabilization induced by lonidamine, arsenite and CD437. Oncogene. 20:7579–7587. - PubMed
    1. Belzacq, A.S., H.L. Vieira, F. Verrier, G. Vandecasteele, I. Cohen, M.C. Prevost, P.X. Petit, A. Kahn, B. Roques, R. Rizzuto, et al. 2003. Bcl-2 and Bax modulate adenine nucleotide translocase activity. Cancer Res. 63:541–546. - PubMed
    1. Boya, P., B. Roques, and G. Kroemer. 2001. Bacterial and viral proteins regulating apoptosis at the mitochondrial level. EMBO J. 20:4325–4331. - PMC - PubMed

Publication types

MeSH terms