. 2006 Dec;74(12):6707-21.
doi: 10.1128/IAI.00789-06. Epub 2006 Sep 18.

Both influenza-induced neutrophil dysfunction and neutrophil-independent mechanisms contribute to increased susceptibility to a secondary Streptococcus pneumoniae infection

Affiliations

Both influenza-induced neutrophil dysfunction and neutrophil-independent mechanisms contribute to increased susceptibility to a secondary Streptococcus pneumoniae infection

Lynnelle A McNamee et al. Infect Immun. 2006 Dec.

Abstract

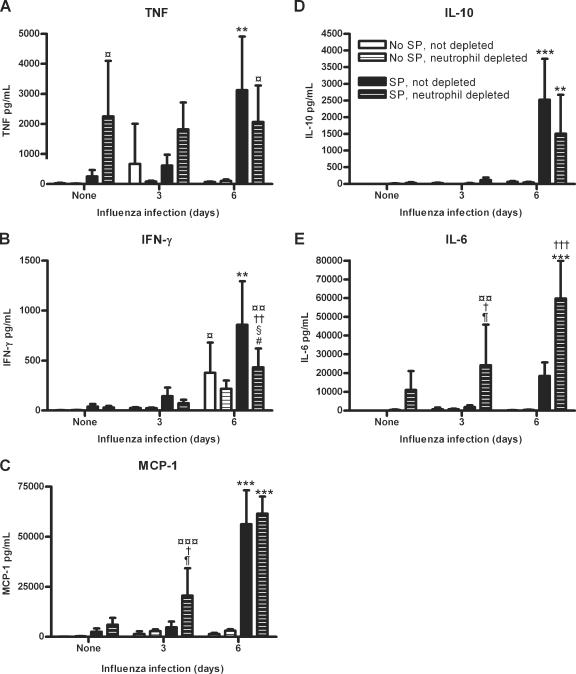
Since secondary Streptococcus pneumoniae infections greatly increase the mortality of influenza infections, we determined the relative roles of neutrophil-dependent and -independent mechanisms in increased susceptibility to S. pneumoniae during influenza infection. Mice infected with influenza for 6 days, but not 3 days, showed a significant increase in susceptibility to S. pneumoniae infection compared to mice not infected with influenza. There was significant neutrophil accumulation in the lungs of S. pneumoniae-infected mice regardless of whether or not they were infected with influenza for 3 or 6 days. Depletion of neutrophils in these mice resulted in increased susceptibility to S. pneumoniae in both the non-influenza-infected mice and mice infected with influenza for 3 days but not in the mice infected with influenza for 6 days, indicating that a prior influenza infection of 6 days may compromise neutrophil function, resulting in increased susceptibility to a S. pneumoniae infection. Neutrophils from the lungs of mice infected with influenza for 3 or 6 days exhibited functional impairment in the form of decreased phagocytosis and intracellular reactive oxygen species generation in response to S. pneumoniae. In addition, neutrophil-depleted mice infected with influenza for 6 days were more susceptible to S. pneumoniae than neutrophil-depleted mice not infected with influenza, indicating that neutrophil-independent mechanisms also contribute to influenza-induced increased susceptibility to S. pneumoniae. Pulmonary interleukin-10 levels were increased in coinfected mice infected with influenza for 6 days but not 3 days. Thus, an influenza infection of 6 days increases susceptibility to S. pneumoniae by both suppression of neutrophil function and by neutrophil-independent mechanisms such as enhanced cytokine production.


Figures

FIG. 1.
FIG. 1.
S. pneumoniae CFU (A) and influenza PFU (B) in lungs after 24 h of S. pneumoniae infection for mice infected with S. pneumoniae only or infected with S. pneumoniae after 3 or 6 days of influenza infection. Data were pooled from three independent experiments with 4 to 5 mice per group per experiment. Significant differences between mice infected with S. pneumoniae only and mice coinfected with influenza and S. pneumoniae are indicated as follows: ***, P < 0.001; NS, P > 0.05. Horizontal lines represent median values for each infection. Data were analyzed using Mann-Whitney U test.
FIG. 2.
FIG. 2.
Percentage of neutrophils in blood of total blood leukocytes (A), total number of neutrophils in BALF (B), and lung S. pneumoniae CFU (C) of nondepleted and RB6-depleted mice at 24 h after S. pneumoniae infection. Mice were infected with S. pneumoniae for 24 h after 3 or 6 days of influenza infection or were only infected with S. pneumoniae for 24 h. Data represent results from two independent experiments with 4 to 5 mice per group per experiment. Significant differences between neutrophil-depleted mice and nondepleted mice are indicated as follows: *, P < 0.05; **, P < 0.01; ***, P < 0.001; NS, P > 0.05. Significant differences between neutrophil-depleted mice infected with S. pneumoniae only and neutrophil-depleted mice coinfected with influenza for 6 days followed by S. pneumoniae as well as differences between neutrophil-depleted mice coinfected with influenza for 3 days followed by S. pneumoniae and neutrophil-depleted mice coinfected with influenza for 6 days followed by S. pneumoniae are indicated as follows: #, P < 0.05; ##, P < 0.01. Horizontal lines represent median values for each infection. Data were analyzed using Mann-Whitney U test.
FIG. 3.
FIG. 3.
Neutrophil counts for BALF (A and B) and bone marrow (C and D) samples from noninfected mice, LPS-stimulated mice, or mice infected with influenza for 3 or 6 days with (B and D) or without (A and C) LPS stimulation. Data represent results from two independent experiments with 3 sets of 2 mice per group. Significant differences between LPS-stimulated mice and mice with both influenza infection and LPS stimulation are indicated as follows: formula imageformula imageformula image, P < 0.001. Data are expressed as means ± standard deviations. Data were analyzed using unpaired t test.
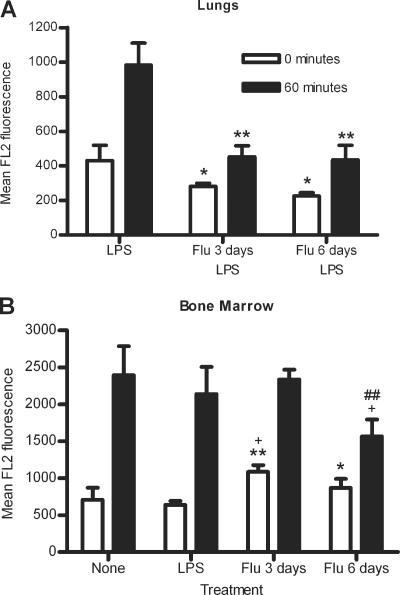
FIG. 4.
FIG. 4.
S. pneumoniae association after 0 or 60 min incubation with lung (A) or bone marrow (B) neutrophils from noninfected mice, LPS-stimulated mice, or mice infected with influenza for 3 or 6 days with (A) or without (B) subsequent LPS stimulation. Data represent results from one (A) or two (B) independent experiments with 3 sets of 2 mice per group. Significance is indicated as follows: *, P < 0.05; **, P < 0.01; ***, P < 0.001 compared to LPS-stimulated mice; +, P < 0.05 compared to noninfected (none) mice; ##, P < 0.01 compared to mice infected with influenza for 3 days. Data are expressed as means ± standard deviations. Data were analyzed using unpaired t test.
FIG. 5.
FIG. 5.
ROS generation by lung (A and B) and bone marrow (C and D) neutrophils from noninfected mice, LPS-stimulated mice, or mice infected with influenza for 3 or 6 days with (A and B) or without (C and D) subsequent LPS stimulation. Neutrophils were incubated with S. pneumoniae (A and C) or PMA (B and D) for 0 or 60 min. Data represent results from one (A and B) or two (C and D) independent experiments with 3 sets of 2 mice per group. Significance is indicated as follows: *, P < 0.05; **, P < 0.01; ***, P < 0.001 compared to LPS-stimulated mice; ##, P < 0.01 compared to mice infected with influenza for 3 days. Data are expressed as means ± standard deviations. Data were analyzed using unpaired t test.
FIG. 6.
FIG. 6.
Lung cytokine levels in neutrophil-depleted and nondepleted mice with or without S. pneumoniae for 24 h and/or influenza virus for 3 or 6 days. TNF (A), IFN-γ (B), MCP-1, IL-10, and IL-6 levels were measured in nondepleted and neutrophil-depleted mice which were not infected, infected with S. pneumoniae only for 24 h, infected with influenza only for 3 or 6 days, or infected with influenza for 3 or 6 days followed by S. pneumoniae for 24 h. Significance is indicated as follows: *, P < 0.05; **, P < 0.01; ***, P < 0.001 for mice infected with influenza virus for 6 days followed by S. pneumoniae compared to noninfected mice, mice infected with S. pneumoniae only, mice infected with influenza virus only, and mice infected with influenza virus for 3 days followed by S. pneumoniae with the same depletion status; ¶, P < 0.05 for mice with the same influenza infection and depletion status to determine the effects of a S. pneumoniae infection; #, P < 0.05 for mice with the same S. pneumoniae infection and depletion status to determine the effects of an influenza infection; †, P < 0.05; ††, P < 0.01; †††, P < 0.001 for mice with the same influenza and S. pneumoniae infections to determine the effects of neutrophil depletion; §, P < 0.05 for mice with the same S. pneumoniae infection and depletion status to determine the effects of 3 days versus 6 days of influenza infection; ¤, P < 0.05; ¤¤, P < 0.01; ¤¤¤, P < 0.001 for mice with the same depletion status to determine the effects of a coinfection or S. pneumoniae infection versus no infection. Data are expressed as means ± standard deviations. Data were analyzed using one-way analysis of variance, followed by the Bonferroni post test.

References

    1. Abramson, J. S., G. S. Giebink, E. L. Mills, and P. G. Quie. 1981. Polymorphonuclear leukocyte dysfunction during influenza virus infection in chinchillas. J. Infect. Dis. 143:836-845. - PubMed
    1. Abramson, J. S., G. S. Giebink, and P. G. Quie. 1982. Influenza A virus-induced polymorphonuclear leukocyte dysfunction in the pathogenesis of experimental pneumococcal otitis media. Infect. Immun. 36:289-296. - PMC - PubMed
    1. Abramson, J. S., and H. R. Hudnor. 1994. Effect of priming polymorphonuclear leukocytes with cytokines (granulocyte-macrophage colony-stimulating factor [GM-CSF] and G-CSF) on the host resistance to Streptococcus pneumoniae in chinchillas infected with influenza A virus. Blood 83:1929-1934. - PubMed
    1. Abramson, J. S., J. C. Lewis, D. S. Lyles, K. A. Heller, E. L. Mills, and D. A. Bass. 1982. Inhibition of neutrophil lysosome-phagosome fusion associated with influenza virus infection in vitro. Role in depressed bactericidal activity. J. Clin. Investig. 69:1393-1397. - PMC - PubMed
    1. Abramson, J. S., D. S. Lyles, K. A. Heller, and D. A. Bass. 1982. Influenza A virus-induced polymorphonuclear leukocyte dysfunction. Infect. Immun. 37:794-799. - PMC - PubMed

Publication types

LinkOut - more resources