. 2006 Nov;129(Pt 11):3006-19.
doi: 10.1093/brain/awl249. Epub 2006 Sep 19.

Role of toll-like receptor signalling in Abeta uptake and clearance

Affiliations

Role of toll-like receptor signalling in Abeta uptake and clearance

Kazuki Tahara et al. Brain. 2006 Nov.

Abstract

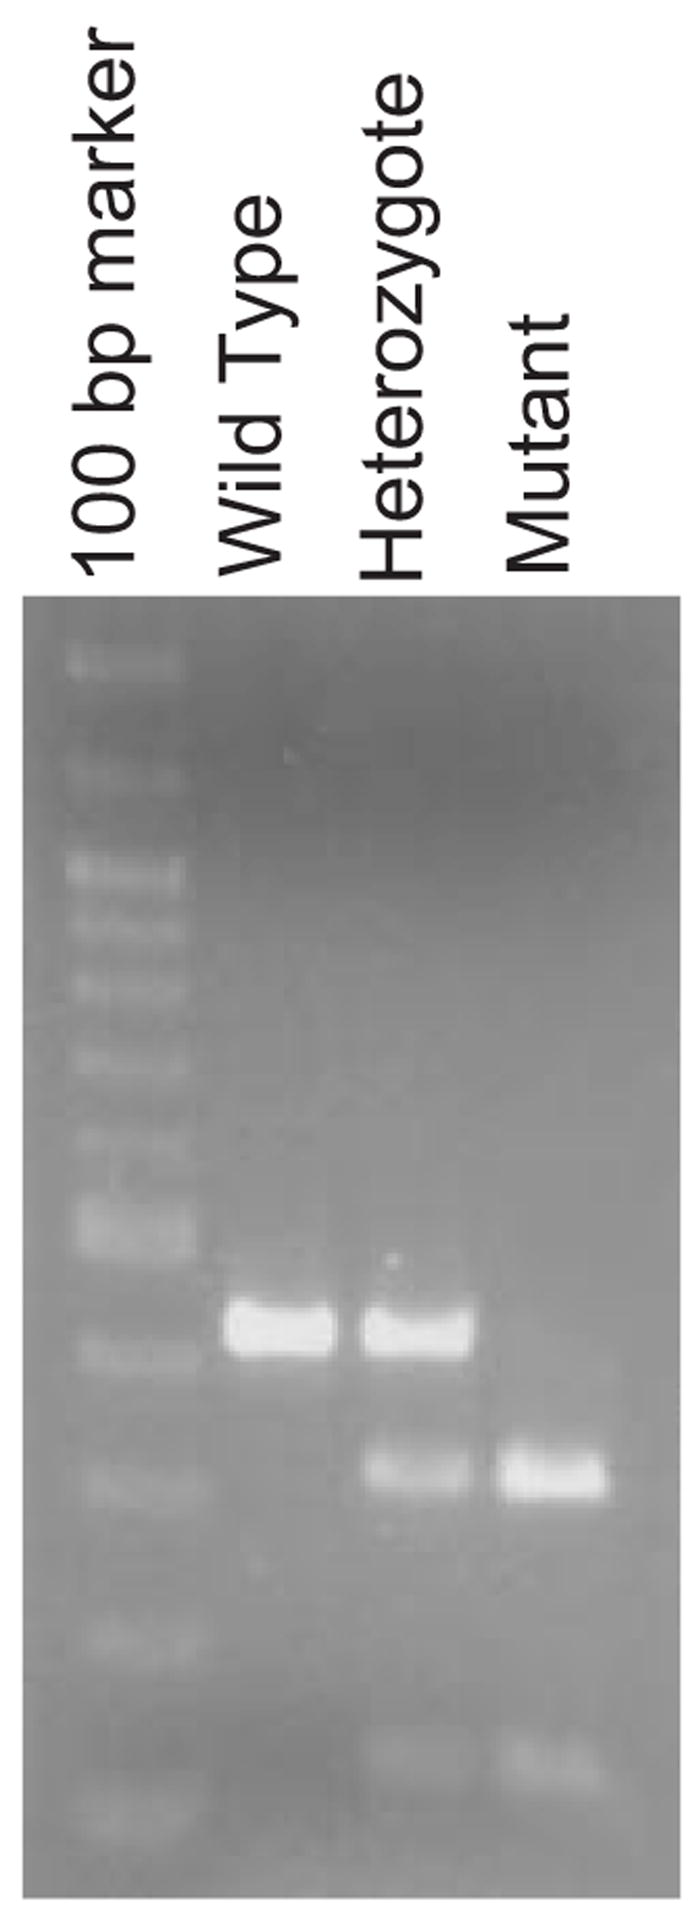
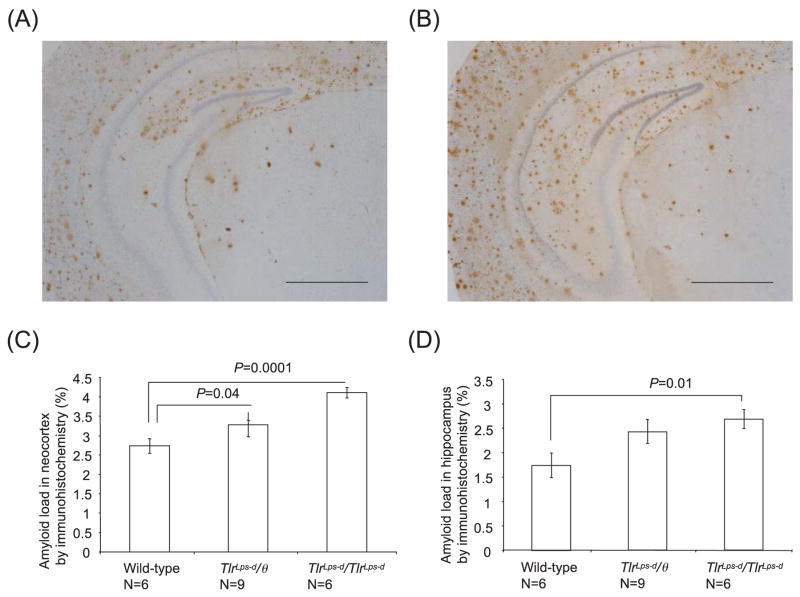
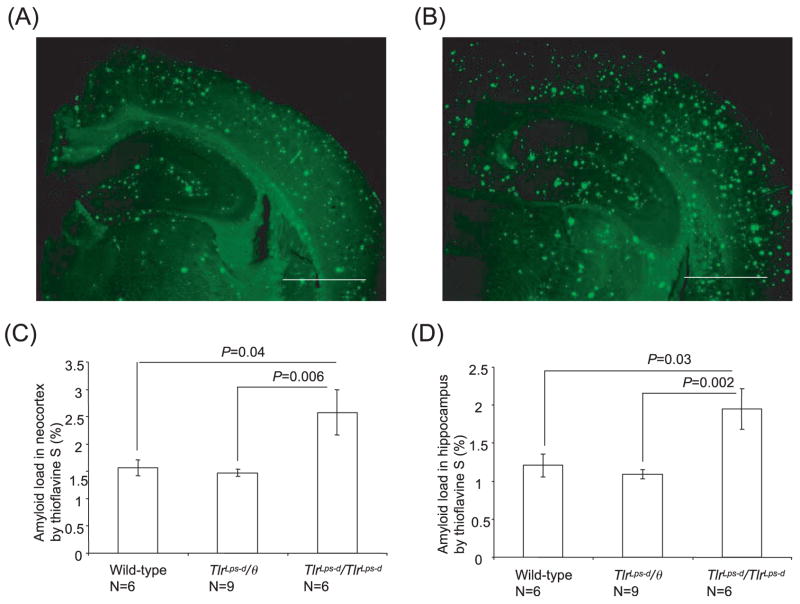
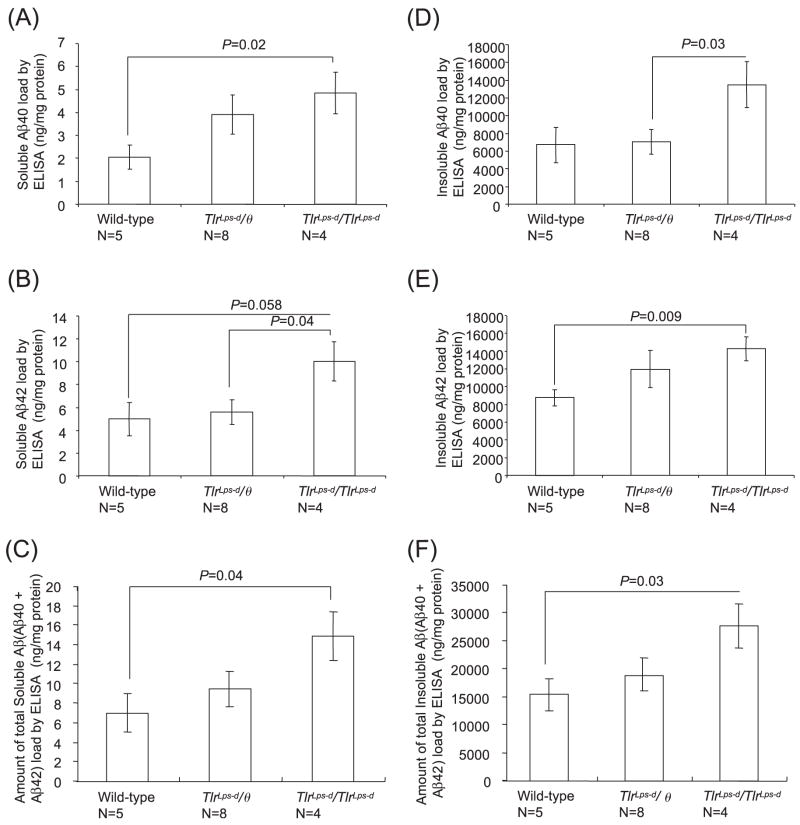
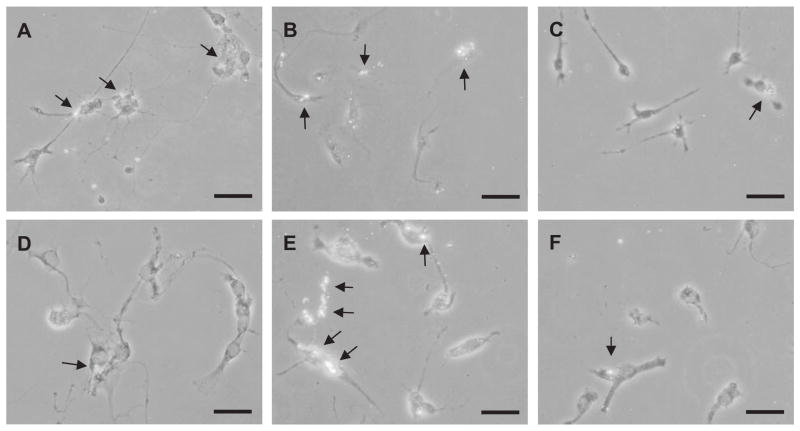
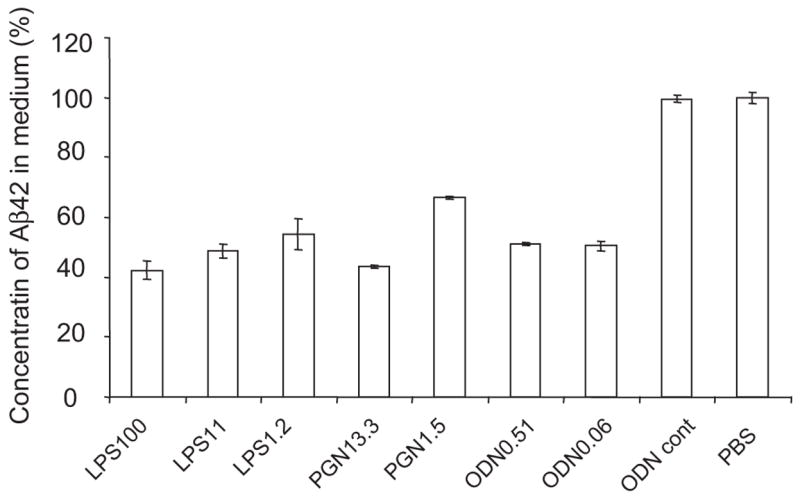
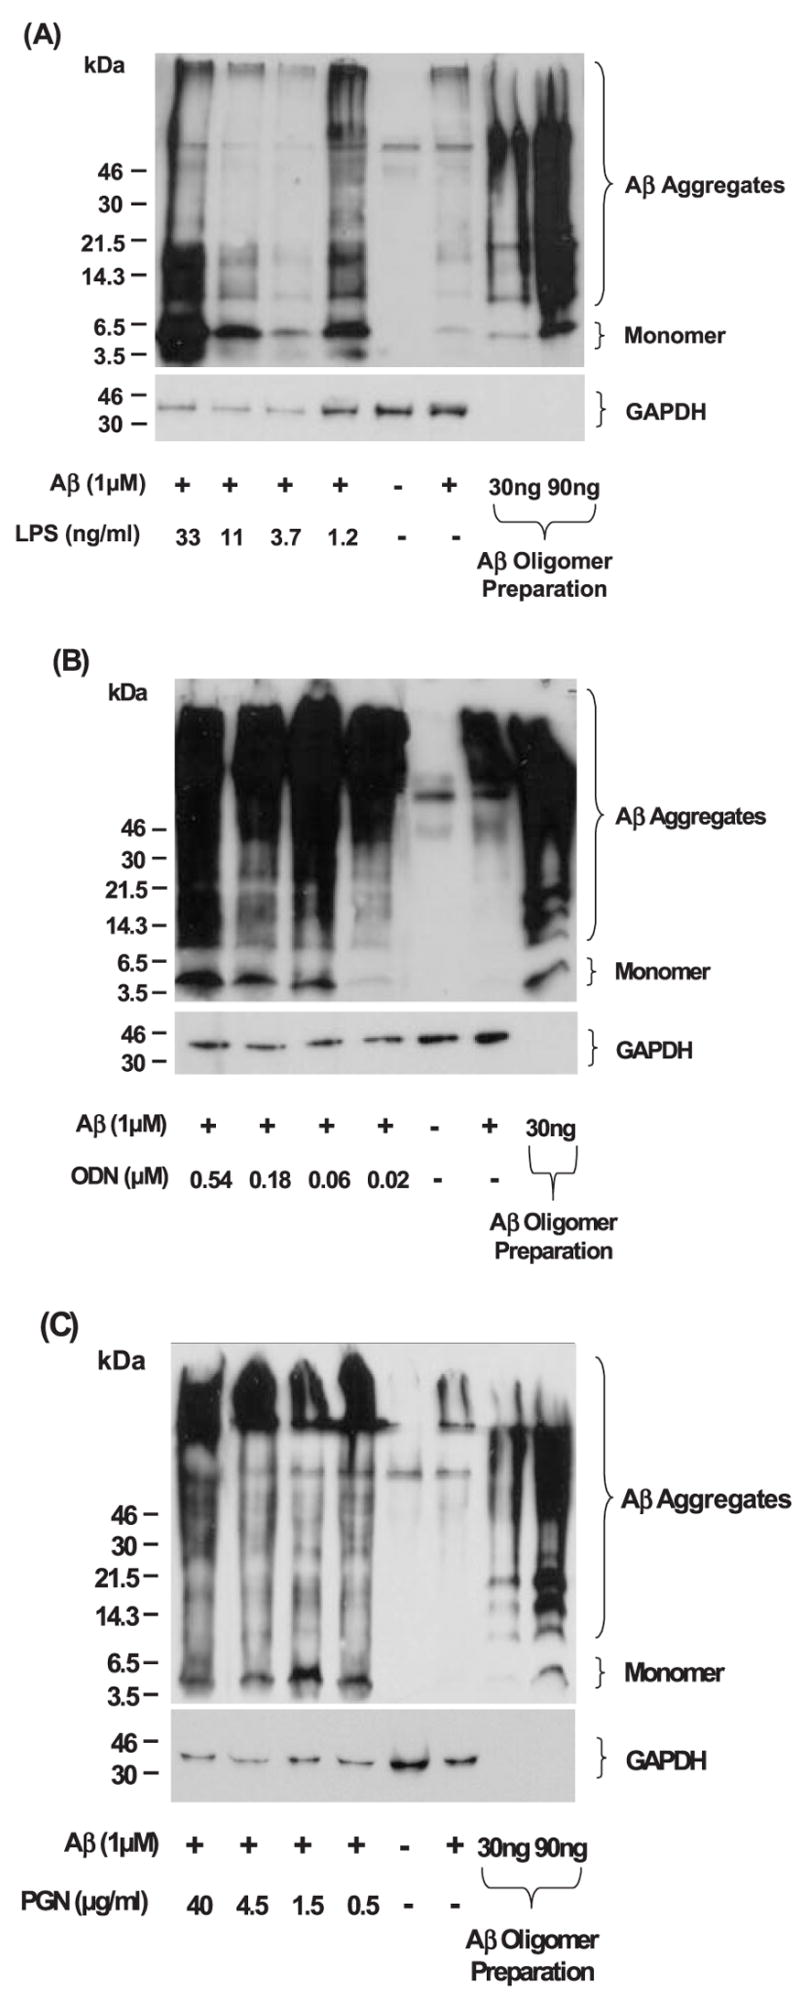
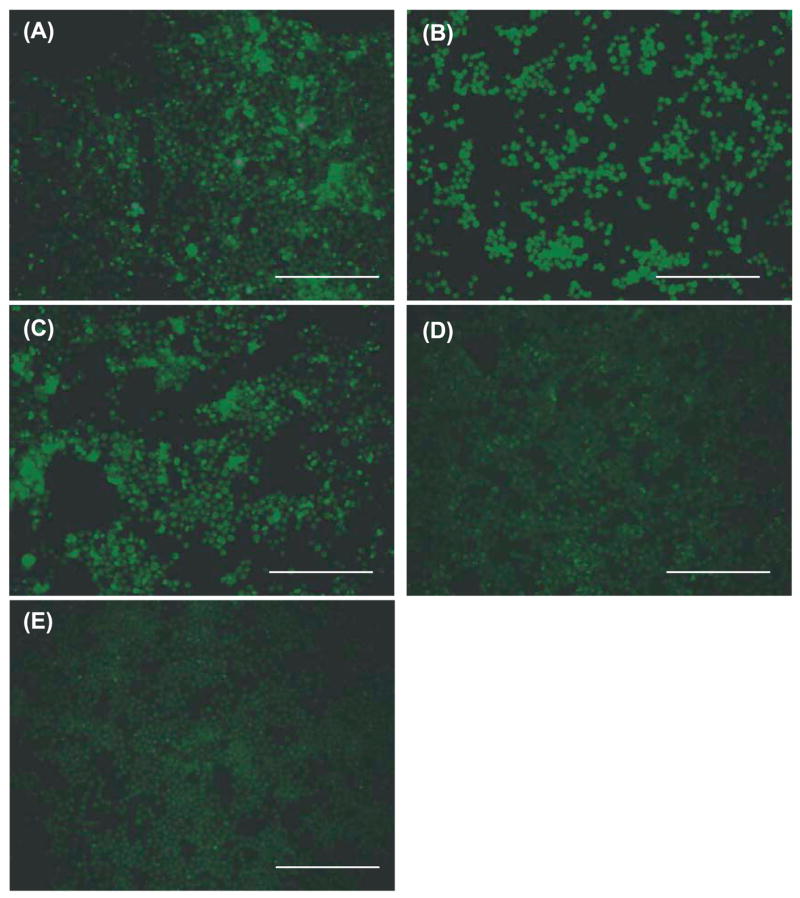
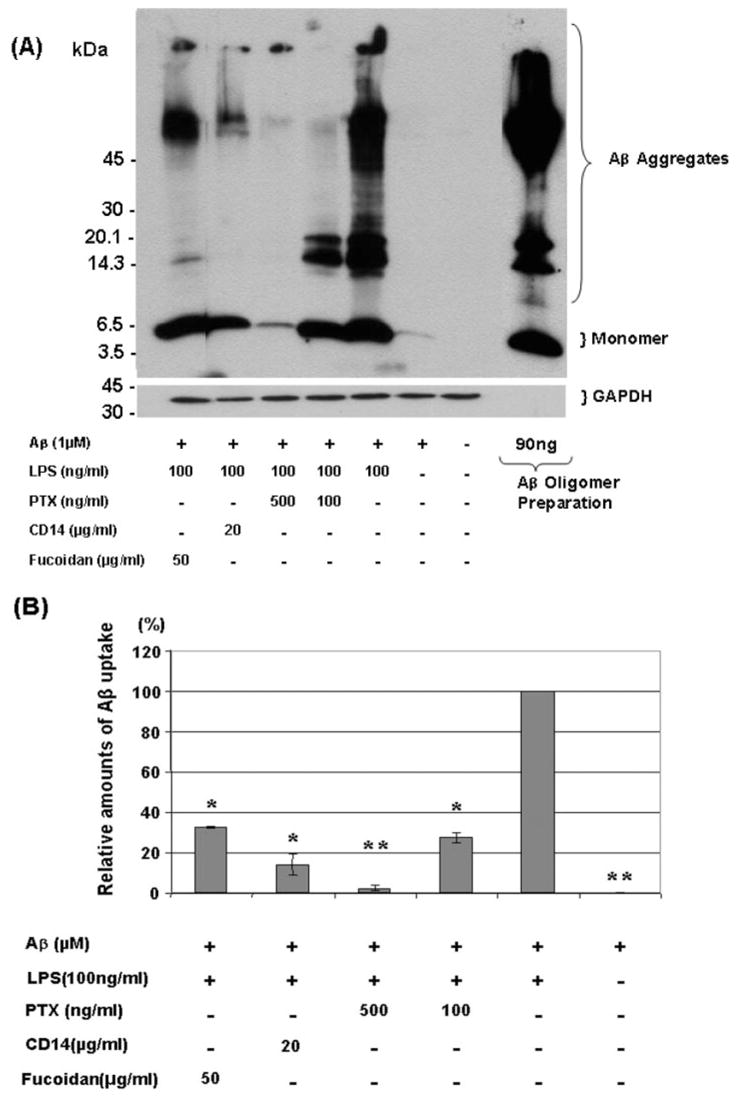
Deposits of amyloid beta-protein (Abeta) in neuritic plaques and cerebral vessels are a pathological hallmark of Alzheimer's disease. Fibrillar Abeta deposits are closely associated with inflammatory responses such as activated microglia in brain with this disease. Increasing lines of evidence support the hypothesis that activated microglia, innate immune cells in the CNS, play a pivotal role in the progression of the disease: either clearing Abeta deposits by phagocytic activity or releasing cytotoxic substances and pro-inflammatory cytokines. Toll-like receptors (TLRs) are a family of pattern-recognition receptors in the innate immune system. Exogenous and endogenous TLR ligands activate microglia. To investigate the role of TLR4 in the amyloidogenesis in vivo, we determined the amounts of cerebral Abeta in Alzheimer's disease mouse models with different genotypes of TLR4 using three distinct methods. We show that mouse models (Mo/Hu APPswe PS1dE9 mice) homozygous for a destructive mutation of TLR4 (Tlr(Lps-d)/Tlr(Lps-d)) had increases in diffuse and fibrillar Abeta deposits by immunocytochemistry, fibrillar Abeta deposits by thioflavine-S staining and buffer-soluble and insoluble Abeta by ELISA in the cerebrum, as compared with TLR4 wild-type mouse models. Although the differences in these parameters were less significant, mouse models heterozygous for the mutation (Tlr(Lps-d)/) showed co-dominant phenotypes. Consistent with these observations in vivo, cultured microglia derived from Tlr(Lps-d)/Tlr(Lps-d) mice failed to show an increase in Abeta uptake after stimulation with a TLR4 ligand but not with a TLR9 ligand in vitro. Furthermore, activation of microglia (BV-2 cell) with a TLR2, TLR4 or TLR9 ligand, markedly boosted ingestion of Abeta in vitro. These results suggest that TLR signalling pathway(s) may be involved in clearance of Abeta-deposits in the brain and that TLRs can be a therapeutic target for Alzheimer's disease.


Figures

Fig. 1
Fig. 1
TLR4 genotyping. A 415 bp DNA fragment was amplified by PCR using mouse tail DNA and two TLR4-specific primers, TLR4sen193 and TLR4ant607. The mutation in the TLR4 gene in C3H/HeJ mice creates an Nla III site in the 415 bp DNA fragment. Nla III digestion of the amplified DNA fragment from a mouse with the mutation produces a 304 and 111 bp DNA fragments. The restriction enzyme polymorphism is shown in the picture for each TLR4 genotype.
Fig. 2
Fig. 2
Detection of diffuse and fibrillar Aβ deposits by anti-Aβ antibody in Mo/Hu APPswe PS1dE9 mice with different TLR4 genotypes. Aβ deposits in the brain are visualized by immunohistochemistry using 6E10 antibody in TLR4 wild-type mice (A) and TlrLps-d/TlrLps-d mice (B). Average percentages of areas showing Aβ immunoreactivity measured by morphometry in the neocortex (C) and hippocampus (D) are shown. In the neocortex, the Aβ load in TLR4 wild-type mice is less than that in TlrLps-d/θ and TlrLps-d/TlrLps-d mice. In the hippocampus, the Aβ load in TlrLps-d/TlrLps-d mice is greater than that in TLR4 wild-type mice. Scale bars 250 μm.
Fig. 3
Fig. 3
Detection of fibrillar Aβ deposits by thioflavine-S fluorescence in Mo/Hu APPswe PS1dE9 mice with different TLR4 genotypes. Fibrillar Aβ deposits show thioflavine-S fluorescence in the brain of TLR4 wild-type mice (A) and TlrLps-d/TlrLps-d mice (B). Average percentages of areas showing thioflavine-S fluorescence measured by morphometry in the neocortex (C) and hippocampus (D) are shown. The Aβ load in TlrLps-d/TlrLps-d mice is greater than that in TlrLps-d/θ mice and TLR4 wild-type mice for the neocortex and hippocampus. Scale bars 250 μm.
Fig. 4
Fig. 4
Quantification of buffer-soluble and insoluble Aβ in the cerebrum by the Aβ40- and Aβ42-specific ELISA. The cerebral buffer-soluble Aβ40 content in TlrLps-d/TlrLps-d mice is higher than that in TLR4 wild-type mice (A). The cerebral buffer-soluble Aβ42 content in TlrLps-d/TlrLps-d mice is higher than that in TlrLps-d/θ mice (B). The amount of total buffer-soluble Aβ (Aβ40 + Aβ42) is higher than that in TLR4 wild-type mice (C). The cerebral insoluble Aβ40 content in TlrLps-d/TlrLps-d mice is higher than that in TlrLps-d/θ mice (D). The cerebral insoluble Aβ42 content in TlrLps-d/TlrLps-d mice is higher than that in TLR4 wild-type mice (E). The amount of total insoluble Aβ (Aβ40 + Aβ42) in TlrLps-d/TlrLps-d mice is higher than that in TLR4 wild-type mice (F).
Fig. 5
Fig. 5
Detection of ingested Aβ42 in primary TLR4 wild-type and TlrLps-d/TlrLps-d microglia by fluorescent immunocytochemistry. Primary TLR4 wild-type (A–C) and TlrLps-d/TlrLps-d (DF) microglia were treated with LPS (100 ng/ml) (A and D), CpG-ODN (0.51 μM) (B and E) or PBS (C and F) and exposed to oligomerized Aβ (0.25 μM) for 24 h. Ingested Aβ42 in the cells shows fluorescence by immunocytochemistry using 6E10 antibody and anti-mouse IgG antibody coupled with Alexa Fluor 488. Arrows indicate ingested Aβ. Scale bars 40 μm.
Fig. 6
Fig. 6
The clearance of Aβ42 from culture media by activation of TLRs on microglia (BV-2 cells). BV-2 cells were treated with LPS at the concentrations of 1.2, 11 and 100 ng/ml, CpG oligodeoxynucleotides (CpG-ODN) at 0.06 and 0.51 μM or peptidoglycan (PGN) at 1.5 and 13.3 μg/ml. BV-2 cells treated with the TLR ligands were incubated with oligomerized Aβ42 for 24 h. As controls, BV-2 cells treated with Control ODN or PBS were used. The concentrations of residual Aβ42 in the culture media were determined by Aβ42-specific sandwich ELISA. The ratios of the Aβ42 concentrations in TLR ligand-treaded media to that in PBS-treated medium are shown. After stimulation with every TLR ligand tested, residual Aβ42 in the medium was reduced by ~50% at the TLR ligand concentrations tested, compared with that in the media from BV-2 cells treated with PBS or control ODN (P < 0.01 for every TLR ligand treatment).
Fig. 7
Fig. 7
Detection of Aβ42 ingested by BV-2 cells after stimulation with TLR ligands. After activation of microglia with TLR ligands, ingested Aβ42 by BV-2 cells are detected by western blots using 6E10 antibody. To monitor the degree of Aβ oligomerization for each experiment, oligomerized Aβ42 was similarly analyzed (the extremely right lanes). Intracellular monomer and aggregates of Aβ are readily detectable in the cell lysates from BV-2 cells treated with TLR ligands at the concentrations of 1.2, 3.7, 11 and 33 ng/ml for LPS (A), 0.02, 0.06, 0.18 and 0.54 μM for CpG-ODN (B) and 0.5, 1.5, 4.5 and 40 μg/ml for PGN (C), while Aβ is barely visible in the cell lysate from BV-2 cells without treatment with TLR ligands. The membranes were reprobed with GAPDH-specific antibody for normalization.
Fig. 8
Fig. 8
Detection of ingested Aβ42 in BV-2 cells by fluorescent immunocytochemistry. After treatment with LPS (100 ng/ml) (A), PGN (13.3 μg/ml) (B) or CpG-ODN (0.51 μM) (C), ingested Aβ42 in BV-2 cells shows fluorescence by immunocytochemistry using 6E10 antibody and anti-mouse IgG antibody coupled with Alexa Fluor 488. BV-2 cells treated with control ODN (D) or PBS (E) show little to no fluorescence. Scale bars 250 μm.
Fig. 9
Fig. 9
Effects of inhibitors on Aβ42 uptake by LPS-activated BV-2 cells. After stimulation with LPS (100 ng/ml), BV-2 cells were treated with pertussis toxin (PTX) (100 or 500 ng/ml), anti-mouse CD14 antibody (20 μg/ml) or fucoidan (50 μg/ml) and incubated with oligomerized Aβ for 24 h. Ingested Aβ42 was detected by western blots using 6E10 antibody (A). Oligomerized Aβ42 was similarly analysed for verification (A, the extreme right lane). The membranes were reprobed with GAPDH-specific antibody for normalization. The amounts of Aβ uptake by LPS-activated BV-2 cells after treatment with chemical inhibitors were compared with those by LPS-activated BV-2 cells without inhibitors by densitometric analysis of the western blots (B). *P < 0.05 and **P < 0.01 compared with LPS-activated BV-2 cells without inhibitors, n = 3, independent samples, t-test.

References

    1. Akira S, Uematsu S, Takeuchi O. Pathogen recognition and innate immunity. Cell. 2006;124:783–801. - PubMed
    1. Akiyama H, Barger S, Barnum S, Bradt B, Bauer J, Cole GM, et al. Inflammation and Alzheimer’s disease. Neurobiol Aging. 2000;21:383–421. - PMC - PubMed
    1. Ard MD, Cole GM, Wei J, Mehrle AP, Fratkin JD. Scavenging of Alzheimer’s amyloid beta-protein by microglia in culture. J Neurosci Res. 1996;43:190–202. - PubMed
    1. Bamberger ME, Harris ME, McDonald DR, Husemann J, Landreth GE. A cell surface receptor complex for fibrillar beta-amyloid mediates microglial activation. J Neurosci. 2003;23:2665–74. - PMC - PubMed
    1. Bard F, Cannon C, Barbour R, Burke RL, Games D, Grajeda H, et al. Peripherally administered antibodies against amyloid beta-peptide enter the central nervous system and reduce pathology in a mouse model of Alzheimer disease. Nat Med. 2000;6:916–9. - PubMed

Publication types