

Distinct memory CD4+ T-cell subsets mediate immune recognition of Epstein Barr virus nuclear antigen 1 in healthy virus carriers
- PMID: 16985171
- PMCID: PMC1785143
- DOI: 10.1182/blood-2006-05-023663
Distinct memory CD4+ T-cell subsets mediate immune recognition of Epstein Barr virus nuclear antigen 1 in healthy virus carriers
Abstract
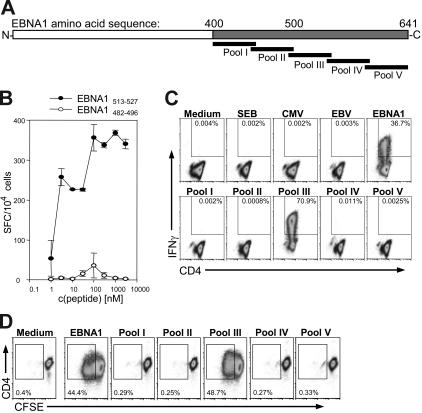
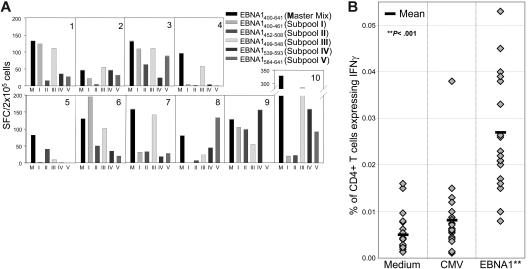
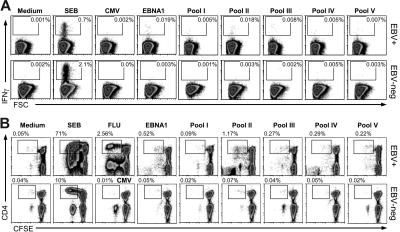
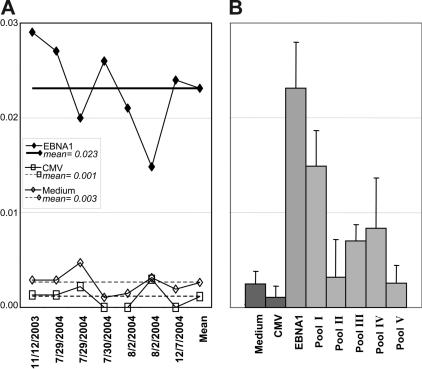
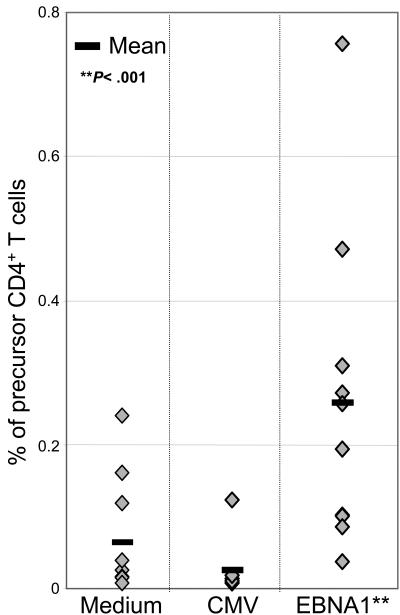
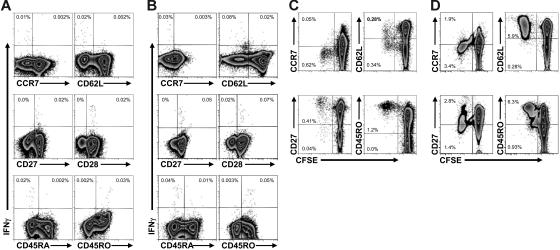
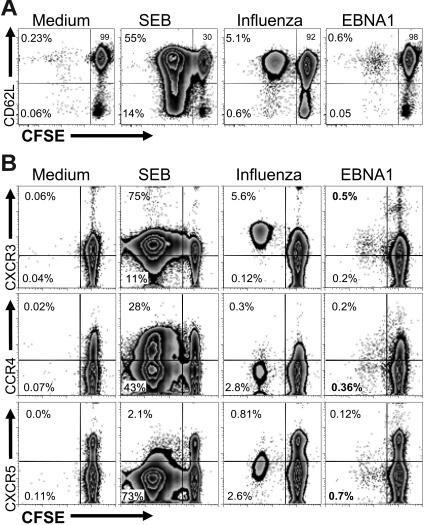
CD4+ T cells, specific for transforming latent infection with the Epstein Barr virus (EBV), consistently recognize the nuclear antigen 1 of EBV (EBNA1). EBNA1-specific effector CD4+ T cells are primarily T-helper 1 (TH1) polarized. Here we show that most healthy EBV carriers have such IFN-secreting EBNA1-specific CD4+ T cells at a frequency of 0.03% of circulating CD4+ T cells. In addition, healthy carriers have a large pool of CD4+ T cells that proliferated in response to EBNA1 and consisted of distinct memory-cell subsets. Despite continuous antigen presence due to persistent EBV infection, half of the proliferating EBNA1-specific CD4+ T cells belonged to the central-memory compartment (TCM). The remaining EBNA1-specific CD4+ T cells displayed an effector-memory phenotype (TEM), of which a minority rapidly secreted IFN upon stimulation with EBNA1. Based on chemokine receptor analysis, all EBNA1-specific TCM CD4+ T cells were TH1 committed. Our results suggest that protective immune control of chronic infections, like EBV, includes a substantial reservoir of TCM CD4+ TH1 precursors, which continuously fuels TH1-polarized effector cells.
Figures
Similar articles
-
EBNA1-specific T cells from patients with multiple sclerosis cross react with myelin antigens and co-produce IFN-gamma and IL-2.J Exp Med. 2008 Aug 4;205(8):1763-73. doi: 10.1084/jem.20072397. Epub 2008 Jul 28. J Exp Med. 2008. PMID: 18663124 Free PMC article.
-
Increased frequency and broadened specificity of latent EBV nuclear antigen-1-specific T cells in multiple sclerosis.Brain. 2006 Jun;129(Pt 6):1493-506. doi: 10.1093/brain/awl067. Epub 2006 Mar 28. Brain. 2006. PMID: 16569670
-
EBNA1-specific CD4+ T cells in healthy carriers of Epstein-Barr virus are primarily Th1 in function.J Clin Invest. 2001 Jan;107(1):121-30. doi: 10.1172/JCI10209. J Clin Invest. 2001. PMID: 11134187 Free PMC article.
-
Contrasting roles of dendritic cells and B cells in the immune control of Epstein-Barr virus.Curr Top Microbiol Immunol. 2003;276:55-76. doi: 10.1007/978-3-662-06508-2_3. Curr Top Microbiol Immunol. 2003. PMID: 12797443 Review.
-
Epstein-Barr virus evasion of CD8(+) and CD4(+) T cell immunity via concerted actions of multiple gene products.Semin Cancer Biol. 2008 Dec;18(6):397-408. doi: 10.1016/j.semcancer.2008.10.008. Epub 2008 Oct 25. Semin Cancer Biol. 2008. PMID: 18977445 Review.
Cited by
-
Targeted delivery of a vaccine protein to Langerhans cells in the human skin via the C-type lectin receptor Langerin.Eur J Immunol. 2022 Nov;52(11):1829-1841. doi: 10.1002/eji.202149670. Epub 2022 Jan 9. Eur J Immunol. 2022. PMID: 34932821 Free PMC article.
-
The Immune Response to Epstein Barr Virus and Implications for Posttransplant Lymphoproliferative Disorder.Transplantation. 2017 Sep;101(9):2009-2016. doi: 10.1097/TP.0000000000001767. Transplantation. 2017. PMID: 28376031 Free PMC article. Review.
-
Detailed analysis of Epstein-Barr virus-specific CD4+ and CD8+ T cell responses during infectious mononucleosis.Clin Exp Immunol. 2008 Aug;153(2):231-9. doi: 10.1111/j.1365-2249.2008.03699.x. Epub 2008 Jun 28. Clin Exp Immunol. 2008. PMID: 18549439 Free PMC article.
-
The Tumor Antigen NY-ESO-1 Mediates Direct Recognition of Melanoma Cells by CD4+ T Cells after Intercellular Antigen Transfer.J Immunol. 2016 Jan 1;196(1):64-71. doi: 10.4049/jimmunol.1402664. Epub 2015 Nov 25. J Immunol. 2016. PMID: 26608910 Free PMC article.
-
Increased frequency of EBV-specific effector memory CD8+ T cells correlates with higher viral load in rheumatoid arthritis.J Immunol. 2008 Jul 15;181(2):991-1000. doi: 10.4049/jimmunol.181.2.991. J Immunol. 2008. PMID: 18606650 Free PMC article.
References
-
- Chan AT, Teo PM, Johnson PJ. Nasopharyngeal carcinoma. Ann Oncol. 2002;13:1007–1015. - PubMed
-
- Macsween KF, Crawford DH. Epstein-Barr virus-recent advances. Lancet Infect Dis. 2003;3:131–140. - PubMed
-
- Nalesnik MA. Clinicopathologic characteristics of post-transplant lymphoproliferative disorders. Recent Results Cancer Res. 2002;159:9–18. - PubMed
-
- Bar RS, DeLor CJ, Clausen KP, Hurtubise P, Henle W, Hewetson JF. Fatal infectious mononucleosis in a family. N Engl J Med. 1974;290:363–367. - PubMed
-
- Purtilo DT, Cassel C, Yang JP. Letter: Fatal infectious mononucleosis in familial lymphohistiocytosis. N Engl J Med. 1974;291:736. - PubMed
Publication types
MeSH terms
Substances
Grants and funding
LinkOut - more resources
Full Text Sources
Other Literature Sources
Research Materials
