. 2006 Dec;17(12):5115-30.
doi: 10.1091/mbc.e05-12-1183. Epub 2006 Sep 20.

Myristoylated, alanine-rich C-kinase substrate phosphorylation regulates growth cone adhesion and pathfinding

Affiliations

Myristoylated, alanine-rich C-kinase substrate phosphorylation regulates growth cone adhesion and pathfinding

Jesse C Gatlin et al. Mol Biol Cell. 2006 Dec.

Abstract

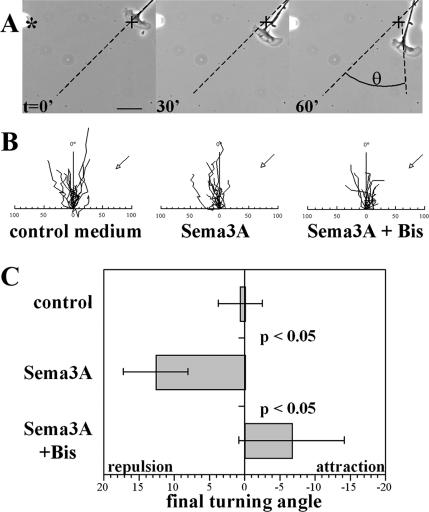
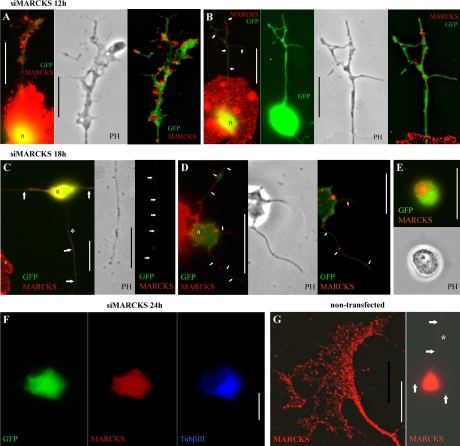
Repellents evoke growth cone turning by eliciting asymmetric, localized loss of actin cytoskeleton together with changes in substratum attachment. We have demonstrated that semaphorin-3A (Sema3A)-induced growth cone detachment and collapse require eicosanoid-mediated activation of protein kinase C epsilon (PKC epsilon) and that the major PKC epsilon target is the myristoylated, alanine-rich C-kinase substrate (MARCKS). Here, we show that PKC activation is necessary for growth cone turning and that MARCKS, while at the membrane, colocalizes with alpha3-integrin in a peripheral adhesive zone of the growth cone. Phosphorylation of MARCKS causes its translocation from the membrane to the cytosol. Silencing MARCKS expression dramatically reduces growth cone spread, whereas overexpression of wild-type MARCKS inhibits growth cone collapse triggered by PKC activation. Expression of phosphorylation-deficient, mutant MARCKS greatly expands growth cone adhesion, and this is characterized by extensive colocalization of MARCKS and alpha3-integrin, resistance to eicosanoid-triggered detachment and collapse, and reversal of Sema3A-induced repulsion into attraction. We conclude that MARCKS is involved in regulating growth cone adhesion as follows: its nonphosphorylated form stabilizes integrin-mediated adhesions, and its phosphorylation-triggered release from adhesions causes localized growth cone detachment critical for turning and collapse.


Figures

Figure 1.
Figure 1.
Role of adhesion in growth cone repulsion. (A) Effect of the substrate on Sema3A-mediated growth cone collapse. Growth cones of DRG neurons were cultured either on laminin- or polylysine-coated surfaces. Phase contrast micrographs were taken just before, and at 7 and 15 min after, Sema3A addition to the culture medium. Growth cone areas were measured, and percentage of change was calculated. *p < 2 × 10⁻⁴ compared with laminin/control or polylysine/Sema3A. For control, n = 21; for Sema3A/laminin, n = 11; and for Sema3A/polylysine, n = 10. (B and C) Redistribution of IRM-dark growth cone adhesions during turning in a microgradient of Sema3A. DRG growth cones on laminin. (B) IRM pictures were taken at the indicated times. The white arrow shows the orientation of the micropipette tip (100 μm away) during the experiment. The black arrow shows the neurite and growth cone axis. (C) Quantitative analysis of close contact area proximal versus distal to the Sema3A gradient, relative to the growth cone axis. This axis was determined for each frame analyzed. Data are from five growth cones. Four of these cones were observed for the entire 45-min experiment, including 15 min before generation of the gradient (time = 0). A fifth control was added to the −15- to 0-min data. The thin horizontal line indicates a ratio of 1.0. The numbers on the top are the average ratios ± SEM for the indicated intervals.
Figure 2.
Figure 2.
Effect of PKC inhibition on Sema3A-induced turning. Growth cones of DRG neurons (on laminin) were exposed to gradients of control medium or of Sema3A. (A) Phase contrast micrographs of a growth cone in a Sema3A gradient, taken at 30-min intervals. The first panel demonstrates the relative positions of the growth cone (+) and the micropipette tip (*) at the start of the experiment. In the third panel, θ is the final turning angle (see below). Bar, 20 μm. (B) Rosebud plots depicting 1-h traces of axonal growth cone translocation in control and Sema3A gradients. Sema3A experiments also were conducted in bath medium with the PKC inhibitor Bis (1 μM). Arrows mark the location of the micropipette tip. Abscissa scale is in micrometers. (C) Rosebud data were analyzed by measuring the final turning angles for each 1-h experiment, mean final turning angles ± SEM. The p values compare control to Sema3A, and Sema3A to Sema3A plus Bis, respectively.
Figure 3.
Figure 3.
Localization of MARCKS, α3-integrin, and adhesions within the growth cone. (A–C) Digitally deconvolved fluorescence micrographs of a DRG growth cone cultured on laminin. The growth cone has been double-labeled with antibodies against α3-integrin and MARCKS. (C) The merged image (overlap in yellow). (D) IRM image of a DRG growth cone cultured on laminin. White arrows point at the PAZ (dark); black arrows mark putative point contacts. Bar, 10 μm.
Figure 4.
Figure 4.
(A) Schematic of the growth cone's leading edge (plm, plasma membrane; gc, growth cone). Top (immunofluorescence), areas measured for colocalization analysis. Bottom (IRM), location of IRM-dark PAZ. (B and C) Results of colocalization analysis by using automatic threshold determination according to Costes et al. (2004). Graphs show, separately for each channel (α3-integrin and MARCKS), the number of pixels that had both channel intensities above threshold, expressed as percentage of the total number of pixels above threshold (means ± SEM). Values are based on the results for RT shown in Table 1. Student's t tests were performed to assess the significance of differences between values. The lowercase letters refer to the p values: a and e, <5 × 10⁻⁷; b, <5 × 10⁻⁵; c, <0.005; d and g, <0.002; f, <10−4; and h, <0.01.
Figure 5.
Figure 5.
PKC-catalyzed phosphorylation and translocation of MARCKS within the growth cone. GCPs (equal amounts of protein per reaction) were either pretreated with vehicle alone or inhibitor (10 nM Bis) for 10 min before exposure to 12(S)HETE (2 min at 30°C) at the indicated concentrations. Reactions were quenched, and samples were fractionated into membranes (plus cytoskeleton; M) and cytosol (C). Western blots of fractions were probed with antibody to total MARCKS (A) or antibody specific for P-MARCKS (B). The amount of immunoreactivity in each fraction was determined using fluorescence intensity and compared with untreated controls. (A) Distribution of total MARCKS protein. Bar graph shows fold increase of cytosolic MARCKS over control (means ± SEM from 3 independent experiments). (B) Representative experiment of 12(S)-HETE-stimulated MARCKS phosphorylation (quantitative data in arbitrary units; indicated below). Almost all P-MARCKS was recovered in the cytosolic fraction.
Figure 6.
Figure 6.
Silencing MARCKS expression in DRG neurons. All experiments included a GFP-encoding plasmid to identify transfected cells. Cells were immunostained for MARCKS (red). (A and B) siMARCKS, 12 h. Transfected neurons contain reduced but variable amounts of MARCKS, and the degree of growth cone spreading seems to correlate with MARCKS levels. The lower power micrographs (left; bar, 20 μm) show neuronal perikarya (n) sitting on top of supporting cells (s). The higher power pictures of growth cones (bar, 10 μm) are either phase contrast (PH) or merged, digitally deconvolved fluorescence images. (C–E) siMARCKS 18 h. Growth cones are not detectable but neurites can be observed. Left, neuronal perikarya and neurites (arrows) at lower power (bar, 20 μm). Phase contrast and deconvolved fluorescence images are shown at higher power to the right (bar, 10 μm). In C, asterisk marks the neurite shown at higher power. (E) Phase contrast and fluorescence micrographs showing a neuron without neurites. Immunofluorescence shows some MARCKS remnants. Bar, 20 μm. (F) siMARCKS, 24 h posttransfection. Neurons lack neurites. MARCKS immunofluorescence seems to recover, but it has not reached control level. Labeling with the marker tubulin βIII identifies this cell as a neuron. (G) Growth cone and perikaryon (right) of a nontransfected neuron in a culture 12 h after transfection. The growth cone image (bar, 10 μm) shows MARCKS immunofluorescence after digital deconvolution. Fluorescence in this panel is reproduced so as to allow direct comparison with other growth cones in this figure. The image of the perikaryon was enhanced to show the neurites (arrows), especially the one (asterisk) that gave rise to the growth cone shown on the left.
Figure 7.
Figure 7.
Effects of siMARCKS and MARCKS-ED expression on total growth cone area (A) and on aggregate close contact area (B). DRG neurons were transfected with GFP only, siMARCKS, or MARCKS-ED plus GFP, and they were grown on laminin. In siMARCKS neurons, growth cone areas were defined as those covered by the distal-most linear 20 μm of the neurite/growth cone and measured in phase-contrast images. For GFP only and MARCKS-ED plus GFP growth cones, IRM images were analyzed by thresholding to determine total and adhesive areas. Results are expressed as mean areas in square micrometers ± SEM. For GFP only, n = 20; for siMARCKS, n = 11; and for MARCKS-ED plus GFP, n = 22.
Figure 8.
Figure 8.
Effect of wtMARCKS-GFP overexpression on TPA-stimulated growth cone collapse. Growth cones of DRG neurons were challenged with 1 μM TPA (0 min, onset of TPA treatment). Top row, time series (taken at 1-min intervals) of phase-contrast images of a nontransfected growth cone. Second row, time series of IRM images of a different, nontransfected growth cone. z, PAZ; asterisk, area of higher order interference. Third and fourth rows, IRM and fluorescence images of a DRG growth cone expressing wtMARCKS-GFP. a, circular profile of unknown nature, possibly owing to the thinned out growth cone's surface topography; b, regions where close contacts coincide with concentrations of wtMARCKS-GFP fluorescence. Growth cones are shown at the same scale.
Figure 9.
Figure 9.
Effect of MARCKS-ED expression on growth cone adhesion and the actin cytoskeleton. (A and B) Single-channel immunofluorescence micrographs of a growth cone growing on laminin and expressing MARCKS-ED, as identified by GFP fluorescence (not shown). Anti-α3-integrin (Alexa Fluor 647-conjugated secondary antibody), rendered in red pseudocolor (A); anti-MARCKS (Alexa Fluor 594-conjugated secondary antibody), rendered in green pseudocolor (B). (C) Merged image. Although overlap (yellow) is extensive, it is not complete, as shown, e.g., in the area marked by asterisk. (D and E) IRM images of growth cones expressing MARCKS-ED and GFP alone, respectively. The arrows in C and D point at reticular pattern of integrin and MARCKS label (C) and of IRM-dense adhesions (D) in MARCKS-ED–expressing growth cones. (F and G) Texas Red-phalloidin labeling of a MARCKS-ED–expressing and control growth cone, respectively. The arrows point at abnormal F-actin distribution, also shown in the inset (deconvolved image). n, neurites. Note large size of MARCKS-ED growth cones relative to controls (see Figure 3). All growth cones are shown at the same magnification (bar, 10 μm).
Figure 10.
Figure 10.
Effect of MARCKS-ED expression on 12(S)-HETE-induced growth cone collapse. Fluorescence micrographs of growth cones expressing GFP alone (left, top row), or GFP and MARCKS-ED (left, bottom row). Images were taken just before (t = 0 min) or 7.5 min after 10−8 M 12(S)-HETE addition to the culture medium. Graph on right shows quantitative analysis of collapse. Growth cone areas were measured at t = 0 min and at 7.5 min after treatment. Results are expressed as mean change in growth cone area ± SEM. For GFP only, n = 13; and for MARCKS-ED plus GFP, n = 11.
Figure 11.
Figure 11.
Effect of MARCKS-ED expression on Sema3A-mediated growth cone repulsion. Growth cone turning experiments were performed as described in Figure 2. (A) Rosebud plots depicting 1-h traces of growth cones exposed to Sema3A gradients. Growth cones were expressing either GFP only (left), or GFP and MARCKS-ED (right). B, average final turning angles, calculated as in Figure 2 (means ± SEM). Value for the extreme neurite dipping below the abscissa (right) was excluded from the statistical analysis. For GFP only, n = 12; for MARCKS-ED plus GFP, n = 11).

References

    1. Aizawa H., et al. Phosphorylation of cofilin by LIM-kinase is necessary for semaphorin 3A-induced growth cone collapse. Nat. Neurosci. 2001;4:367–373. - PubMed
    1. Allen L. A., Aderem A. Protein kinase C regulates MARCKS cycling between the plasma membrane and lysosomes in fibroblasts. EMBO J. 1995;14:1109–1120. - PMC - PubMed
    1. Arregui C. O., Carbonetto S., McKerracher L. Characterization of neural cell adhesion sites: point contacts are the sites of interaction between integrins and the cytoskeleton in PC12 cells. J. Neurosci. 1994;14:6967–6977. - PMC - PubMed
    1. Barberis D., Artigiani S., Casazza A., Corso S., Giordano S., Love C. A., Jones E. Y., Comoglio P. M., Tamagnone L. Plexin signaling hampers integrin-based adhesion, leading to Rho-kinase independent cell rounding, and inhibiting lamellipodia extension and cell motility. FASEB J. 2004;18:592–594. - PubMed
    1. Berditchevski F., Odintsova E. Characterization of integrin-tetraspanin adhesion complexes: role of tetraspanins in integrin signaling. J. Cell Biol. 1999;146:477–492. - PMC - PubMed

Publication types

MeSH terms

LinkOut - more resources