Comparative Study
. 2006 Sep 20;26(38):9761-70.
doi: 10.1523/JNEUROSCI.5605-05.2006.

Integrated neural processes for defining potential actions and deciding between them: a computational model

Affiliations
Comparative Study

Integrated neural processes for defining potential actions and deciding between them: a computational model

Paul Cisek. J Neurosci. .

Abstract

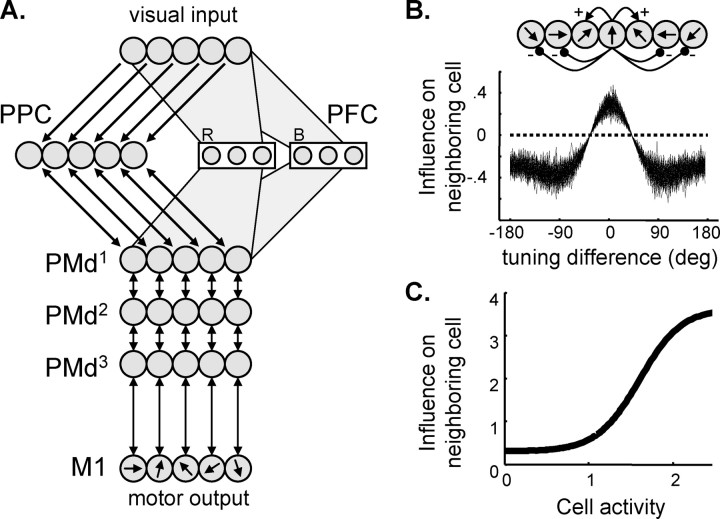
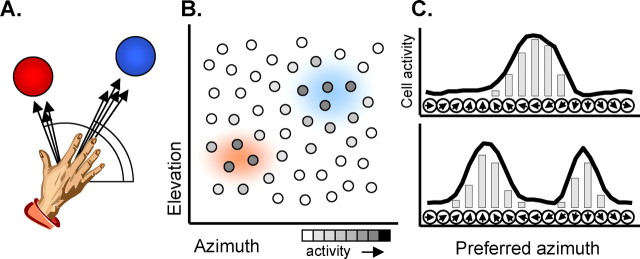
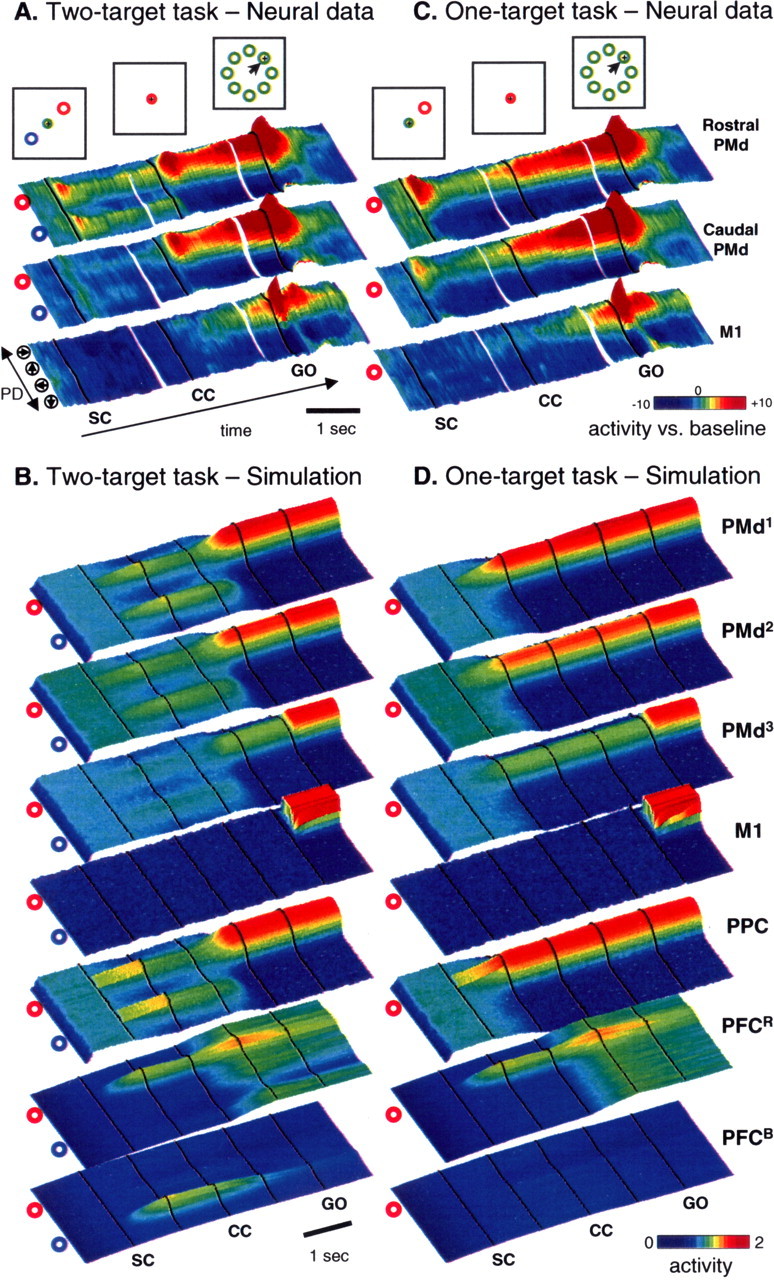
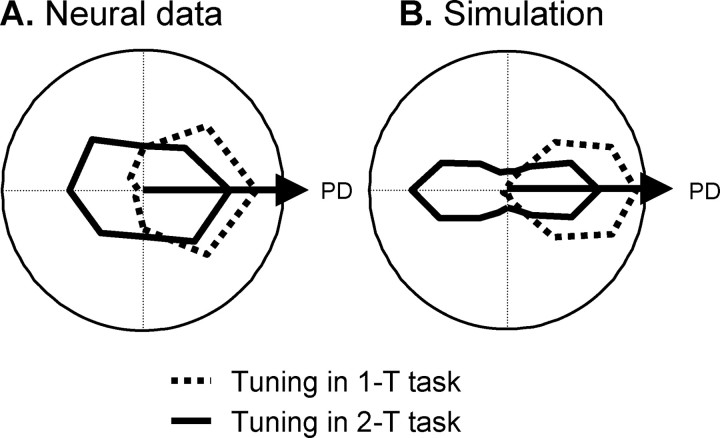
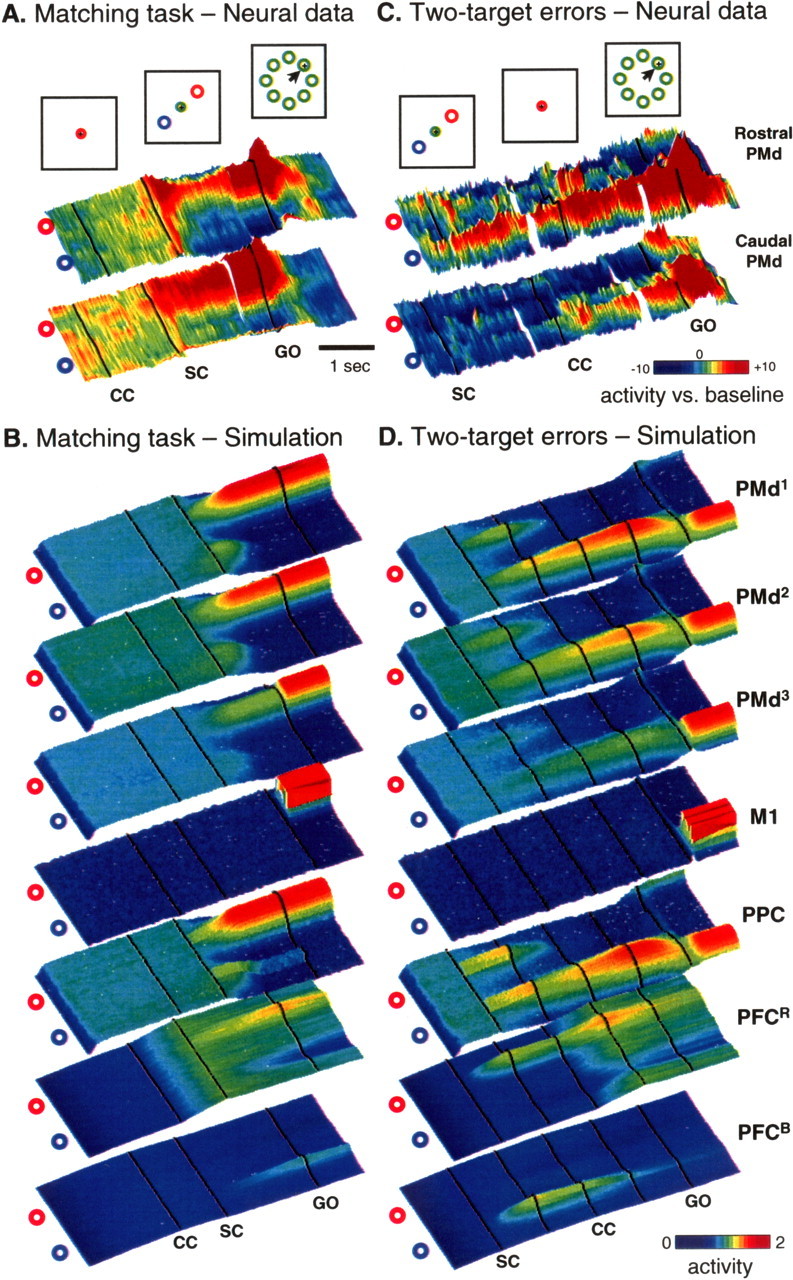
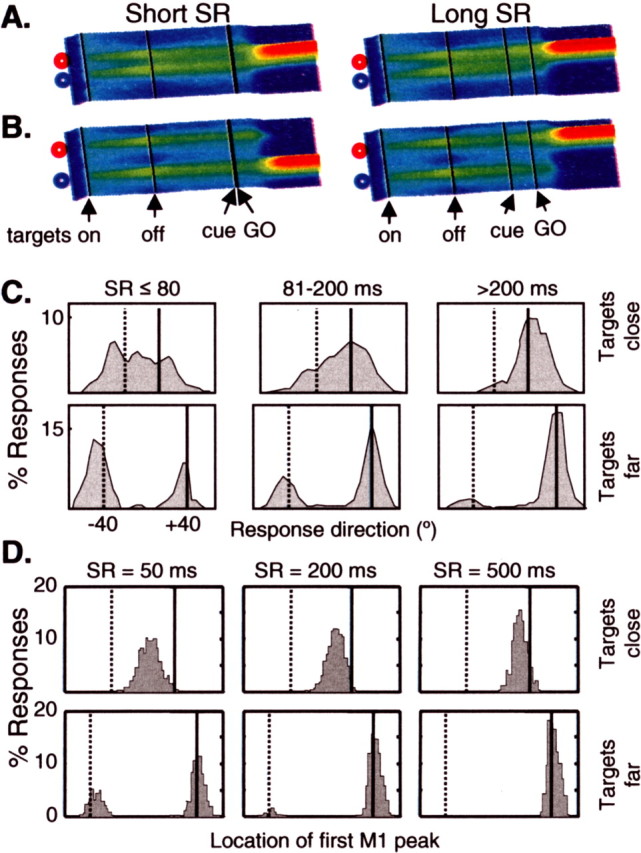
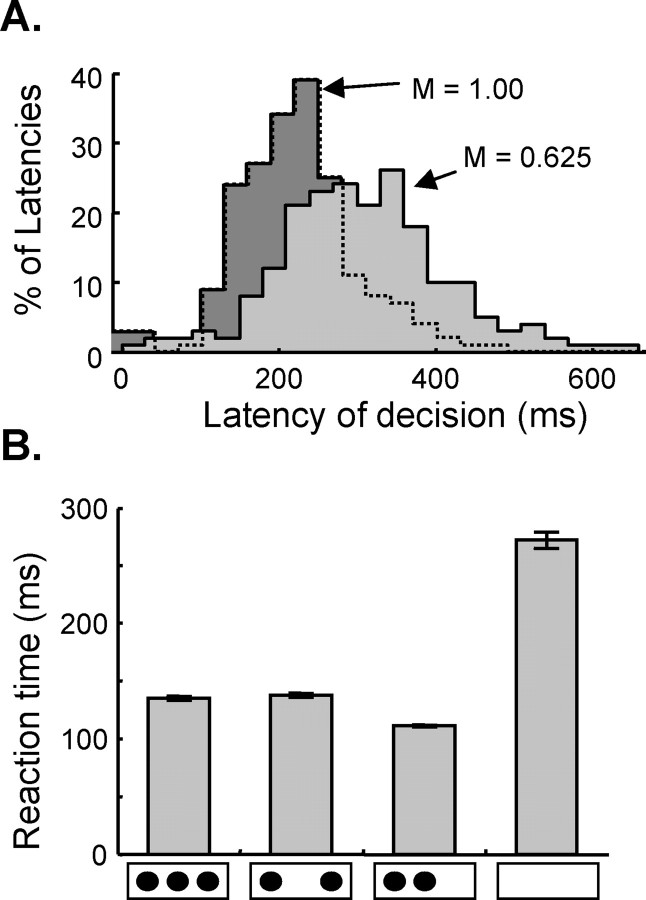
To successfully accomplish a behavioral goal such as reaching for an object, an animal must solve two related problems: to decide which object to reach and to plan the specific parameters of the movement. Traditionally, these two problems have been viewed as separate, and theories of decision making and motor planning have been developed primarily independently. However, neural data suggests that these processes involve the same brain regions and are performed in an integrated manner. Here, a computational model is described that addresses both the question of how different potential actions are specified and how the brain decides between them. In the model, multiple potential actions are simultaneously represented as continuous regions of activity within populations of cells in frontoparietal cortex. These representations engage in a competition for overt execution that is biased by modulatory influences from prefrontal cortex. The model neural populations exhibit activity patterns that correlate with both the spatial metrics of potential actions and their associated decision variables, in a manner similar to activities in parietal, prefrontal, and premotor cortex. The model therefore suggests an explanation for neural data that have been hard to account for in terms of serial theories that propose that decision making occurs before action planning. In addition to simulating the activity of individual neurons during decision tasks, the model also reproduces key aspects of the spatial and temporal statistics of human choices and makes a number of testable predictions.


Figures

Figure 1.
Figure 1.
Computational model. A, Network architecture. Each layer consists of neurons with different directional preferences, and different layers are connected with recurrent topographic projections. Neurons along the frontoparietal stream (PPC–PMd–M1) have high directional resolution but no color sensitivity. In contrast, neurons in the PFC combine color sensitivity and low directional resolution. B, Within each of the frontoparietal layers, cells with similar directional preferences excite each other, whereas cells with different preferences mutually inhibit each other. The plot shows how this influence varies as a function of the difference in preferred direction. The thickness of the line illustrates the magnitude of random variations. C, The influence of a PMd cell on its neighbor is plotted as a function of its activity.
Figure 2.
Figure 2.
Distributed representation of multiple potential actions. A, The presence of two objects within reach (colored spheres) specifies a variety of potential directions for reaching actions (arrows). B, These potential actions can be simultaneously encoded within a population of neurons sensitive to specific parameters of movement (e.g., azimuth and elevation). This is shown as a map in which individual cells (circles) lie at points determined by their preference for particular values of those parameters. A given pattern of cell activities within the population defines contiguous regions of activity on this map, corresponding to particular reaching actions (colored regions). C, The activity across a population of cells can represent a single potential action (top) or it can specify several potential actions as separate peaks of activity (bottom). Narrow peaks define actions with high levels of precision, whereas broad peaks can be used to specify a parameter more vaguely. The magnitude of activity of a given peak indicates the likelihood that the final selected action will have the parameter values specified by that peak.
Figure 3.
Figure 3.
Comparison of model cell activity with neural activity in PMd and M1 during two reaching tasks. A, Neural population data from PMd and M1 of two monkeys performing the two-target task (Cisek and Kalaska, 2005). Examples of the stimuli viewed by the monkeys are shown at the top. In each three-dimensional color panel, average activity of cells with a given PD is plotted along the shorter side, and 10 ms slices of time are plotted along the long side. Color indicates change in firing from baseline (see scale). From left to right, panels are aligned on SC onset, CC onset, and Go signal. The top row shows activity from the rostral part of PMd, the middle row from caudal PMd, and the bottom row from M1. B, Simulation of the two-target task. As in the neural data, activity is represented in colored panels with time along the long axis and cells sorted by PD along the short axis. Activity in all seven model populations is shown. In the simulation, the two targets were presented (SC; 1st black line) at the two locations indicated to the left of each panel (activating visual units i = 21… 29, and i = 61… 69) and then disappeared (2nd black line). The CC (3rd black line) was simulated as uniform excitation to the red-preferring PFC population and then turned off (4th black line). Finally, the Go signal was given (5th black line). C, Neural population data during the one-target task, with the same format as in A. D, Simulation of the one-target task, with the same format as in B.
Figure 4.
Figure 4.
Tuning functions during the spatial-cue period of the one-target (dotted line) and two-target (solid line) tasks, plotted as a polar plot that is aligned to the preferred direction of each cell. A, Average tuning function of cells in rostral PMd (Cisek and Kalaska, 2005). B, Tuning functions from the PMd1 model population.
Figure 5.
Figure 5.
Simulation of the matching task and two-target task errors. A, Neural data from PMd of two monkeys performing the matching task (Cisek and Kalaska, 2005), with same format as in Figure 3A. B, Simulation of the matching task. In the simulation, a uniform excitation was given to the red-preferring PFC population (CC; 1st black line), followed by presentation of the two targets (SC; 2nd black line). C, Neural data from PMd during trials in which the monkeys made an error in the two-target task, ultimately moving to the wrong target. D, A simulation of the two-target task, with parameters and inputs identical to those in Figure 3B. In this run of the simulation, noise caused the model to make an error and select the wrong target.
Figure 6.
Figure 6.
Spatial distribution of reaching choices. A, Simulated activity from PMd1 when two nearby targets appear (1st black line) and then vanish (2nd black line), and then the red target is flashed (cue; 3rd black line) shortly before the Go signal (4th black line). On the left is a trial in which the cue appears 20 ms before the Go signal, and on the right, a trial in which the cue is presented 300 ms before the Go signal. B, Same as A, except with targets farther apart. C, Distribution of initial reach directions of humans in an isometric variant of the timed-response task (Ghez et al., 1997) for two different target separations and three different SR intervals. Solid line, Correct direction; dotted line, wrong direction. D, Distribution of the location of the first peak in M1 during simulations of the timed-response task, also for two target separations, and three SR intervals.
Figure 7.
Figure 7.
Simulations of timing phenomena. A, Distributions of decision latencies produced by the model in the 2-T task with two different magnitudes (M) of the color cue. These latencies were calculated by finding the first time step, after the color cue, at which the PMd1 population crossed an activity threshold of 1.5. B, Reaction time (mean and SE) during four conditions (from left to right): when three cues are presented 80° apart (i.e., spanning 160°) 0.8 s before the target, when two cues are presented 160° apart, when two cues are presented 80° apart, and when no cues are presented until the target and GO signal are given.

Comment in

Similar articles

Cited by

References

    1. Basso MA, Wurtz RH. Modulation of neuronal activity in superior colliculus by changes in target probability. J Neurosci. 1998;18:7519–7534. - PMC - PubMed
    1. Bhushan N, Shadmehr R. Computational nature of human adaptive control during learning of reaching movements in force fields. Biol Cybern. 1999;81:39–60. - PubMed
    1. Bock O, Eversheim U. The mechanisms of movement preparation: a precuing study. Behav Brain Res. 2000;108:85–90. - PubMed
    1. Boynton GM. Attention and visual perception. Curr Opin Neurobiol. 2005;15:465–469. - PubMed
    1. Carello CD, Krauzlis RJ. Manipulating intent: evidence for a causal role of the superior colliculus in target selection. Neuron. 2004;43:575–583. - PubMed

Publication types

MeSH terms

LinkOut - more resources