Comparative Study
. 2006 Sep 20;26(38):9780-93.
doi: 10.1523/JNEUROSCI.0840-06.2006.

Identification of sequence motifs that target neuronal nicotinic receptors to dendrites and axons

Affiliations
Comparative Study

Identification of sequence motifs that target neuronal nicotinic receptors to dendrites and axons

Jian Xu et al. J Neurosci. .

Abstract

Neuronal nicotinic acetylcholine receptors (nAChRs) belong to a family of ligand-gated ion channels that play important roles in central and peripheral nervous systems. The subcellular distribution of neuronal nAChRs has important implications for function and is not well understood. Here, we analyzed the targeting of two major types of neuronal nAChRs by expressing epitope-tagged subunits in cultured hippocampal neurons. Surprisingly, the alpha7 nAChR (alpha7) and alpha4/beta2 nAChR (alpha4beta2) displayed distinct patterns of expression, with alpha7 targeted preferentially to the somatodendritic compartments, whereas alpha4beta2 was localized to both axonal and dendritic domains. When fused to CD4 or IL2RA (interleukin 2 receptor alpha subunit) proteins, which are normally distributed ubiquitously, the M3-M4 intracellular loop from the alpha7 subunit promoted dendritic expression, whereas the homologous M3-M4 loop from the alpha4 subunit led to surface axonal expression. Systemic screening and alanine substitution further identified a 25-residue leucine motif ([DE]XXXL[LI]) containing an axonal targeting sequence within the alpha4 loop and a 48-residue dileucine and tyrosine motif (YXXØ) containing a dendritic targeting sequence from the alpha7 loop. These results provide valuable information in understanding diverse roles of neuronal nAChRs in mediating and modulating synaptic transmission, synaptic plasticity, and nicotine addiction.


Figures
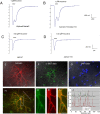
Figure 1.
Figure 1.
Tagging the receptors at C termini does not affect function and assembling of neuronal nAChRs. A–D, Representative examples of nicotine-induced currents from oocytes expressing wild-type α4β2 (A), α4–HA/β2–HA (B), wild-type α7 (C), and α7–HA (D). Voltage clamping was performed 24 h after injecting RNA into Xenopus oocytes. E–J, Surface staining of recombinant α7 is consistent with α-bungarotoxin labeling. Hippocampal neurons were transfected with α7–HA at 8 DIV and stained at 12 DIV. E, Surface expression of recombinant α7 stained by HA antibody. F, Surface expression of α7 stained by α-bungarotoxin (a-BGT). G, Same view as E and F. Cell nuclei were labeled with 4′,6′-diamidino-2-phenylindole dihydrochloride (DAPI) to show that one neuron of many from this view was transfected and that the surface expression level of endogenous α7 from nontransfected cells in this view was below detection using fluorescence-labeled α-bungarotoxin in our experiments. H, Overlay of E and F shows the consistent labeling of surface α7 by HA antibody and α-bungarotoxin, except for occasional nonspecific labeling of apparent cell debris by Alexa 488–α-bungarotoxin. I, Enlarged boxed region from H. Ia, HA stain. Ib, a-BGT stain. Ic, Overlay of Ia and Ib. J, Immunofluorescence intensity profiles along the 100 μm line in H were measured from the original TIFF (tagged image file format) images with NIH ImageJ. Scale bars: (in G) E–H, 50 μm; I, 15 μm.
Figure 2.
Figure 2.
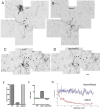
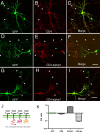
Differential targeting of α7 and α4β2 expressed in cultured hippocampal neurons. A–D, Neurons were transfected at 8 DIV with α7–HA plus GFP. Surface receptor was labeled at 16 DIV with HA antibody. GFP fluorescence was used to outline neuronal morphology. Multiple images were taken from the LSM 510 confocal microscope and assembled to obtain a larger view. Unlike GFP (A), surface α7 (B) was targeted to dendrites and excluded from axons (arrowheads). Low surface expression of α7 was detected at initial regions of axons. This signal sharply decreased along the axonal process. Also note that surface expression of α7 in transfected glia cells (A, top left) was below detection in B. Surface expression of the α4β2 receptor (D) was localized to both soma-dendrites and axons in the transfected neuron also expressing GFP (C). Scale bar, 50 μm. Note that the surface α4β2 level was considerably lower than that of α7. Higher amplification in microscope scanning was necessary to acquire α4β2 imaging. E–G, Quantitative analysis of receptor polarization in neurons. E, Percentage of cells expressing recombinant proteins in axons. Unlike GFP and α4β2, surface expression of α7 at axons ∼200 μm away from the cell body was detected in only 5% of transfected cells (10 independent transfections). F, Normalized ratios of average fluorescence intensity for dendrites versus axons (see methods in supplemental Fig. 1, available at www.jneurosci.org as supplemental material). G, Averaged intensity profiles of surface α4β2 and α7 along axons. The method used is described in supplemental Figure 1 (available at www.jneurosci.org as supplemental material). The decay constant for α7 traveling along axons was estimated to be 45.6 μm. There is no reduction of α4β2 signal along axons. Error bars are SEM.
Figure 3.
Figure 3.
Direct comparisons of surface α7 and α4β2 in the same transfected neuron. A, B, Hippocampal neurons were cotransfected with α7–GFP and HA-tagged α4 and β2 (α4–HA/β2–HA) at 8 DIV. Surface α7 was stained by chicken anti-GFP antibodies, and surface α4β2 was stained by mouse anti-HA antibody at 16 DIV. Neurons were fixed and blocked before incubating with secondary antibody (Alexa 568-labeled goat anti-mouse and Alexa 647-labeled goat anti-chicken antibodies). Images were scanned from the LSM 510 confocal microscope. Pseudocolors were initially applied to represent surface signals of α7 (green) and α4β2 (red) before converting to gray channel. Multiple images were taken from the LSM 510 confocal microscope and were assembled to obtain a larger view. Surface α7 was mostly expressed in soma-dendrites; a faint signal can be detected at initial axonal regions, but it decreased below detection along the axons (A). Surface α4β2 was expressed at both axons and soma-dendrites (B). Arrowheads indicate axon regions. C, D, Intensity line profiles of α7 and α4β2 along axons from the transfected neuron shown in A and B. Arrows mark the start of blank regions. E, F, Neurons were transfected and stained similarly to those in A and B, except that staining was performed at 22 DIV. A neuron expressing both α7–GFP and α4–HA/β2–HA is shown in E. The boxed region from E is enlarged in F. Although α7 and α4β2 were both expressed in somatodendritic compartments, a large fraction of surface clusters from different receptors did not overlap (F). Scale bars: (in B) A, B, 100 μm; E, 30 μm; F, 10 μm.
Figure 4.
Figure 4.
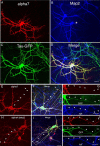
Comparison of α7 and α4β2 with dendritic and axonal markers. A–D, α7–HA was cotransfected with Tau–GFP into cultured neurons at 8 DIV and stained at 12 DIV. Surface α7 (A) was MAP2 positive (B) but did not overlap with Tau–GFP in axons (C). D, Merged images of A–C. The asterisk in B indicates the transfected neuron. E–G, HA-tagged receptor subunits were cotransfected with GFP into cultured neurons at 8 DIV. Neurons were triple labeled with surface α7 or α4β2 (red), GFP (green), and neurofilament (blue) at 12 DIV (F, I). Surface α7 (E) was mostly excluded from axons labeled by neurofilament antibody (F, G). In contrast, surface α4β2 (H) was found in neurofilament-positive axonal fibers (I, J). Boxed regions in F and I are shown with separated channels at higher magnification in G and J, respectively. Arrowheads mark axons. NF, Neurofilament. Scale bars: (in D) A–D, 50 μm; (in F, G, I, J) E–J, 25 μm.
Figure 5.
Figure 5.
Differential targeting of α7 and α4β2 in GABAergic neurons. A–D, Transfected GABAergic neuron triple labeled with surface α7 (A), GFP (B), and GABA (D). C, Merged A and B. Surface α7 was not detected in axons (arrowheads). E–H, Transfected GABAergic neuron triple labeled with surface α4β2 (E), GFP (F), and GABA (H). H, Merged E and F. Surface α4β2 resided in axons and dendrites of GABAergic neurons. Scale bar, 50 μm.
Figure 6.
Figure 6.
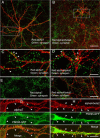
The locations of α7 at spines and filopodia-like structures. Shown are dendritic regions from hippocampal neurons cotransfected with α7–HA and PSD-95–GFP at 8 DIV. Cultures at 12 (A1–A4), 17 (B1–B4), and 22 (C1–C4) DIV were triple labeled with surface α7, PSD-95–GFP, and endogenous GluR1. Arrowheads label colocalized puncta of α7, PSD-95, and GluR1. Arrows point to locations at the tip or neck of filopodia-like structures at which α7 was present, but PSD-95 and GluR1 were not. Spine synapses were more evident in older neurons. The fraction of filopodia-like structures decreases progressively as the neurons mature. Consistent with this time course, α7 distribution was shifted to punctate clustering similar to that of PSD-95 and GluR1. The overall Pearson's coefficient of α7 to PSD-95 increased from 0.71 ± 0.024 (n = 10; 12 DIV) to 0.78 ± 0.022 (n = 10; 17 DIV; p = 0.037, t test) and farther to 0.82 ± 0.025 (n = 10; 22 DIV; p = 0.26, t test, 17 vs 22 DIV). Scale bars, 15 μm.
Figure 7.
Figure 7.
Comparisons of recombinant α7 with endogenous synaptic markers. A–D, 3D reconstruction from image stacks scanned from a cell (22 DIV) transfected previously by α7 and GFP. α7 surface expression (C, red) was concentrated on spines (arrowheads) and often juxtaposed to presynaptic clusters labeled with anti-synapsin antibody (B, blue; D, merged). A small fraction of α7 puncta was also seen at filopodia-like structures (A, C, arrows) that usually do not have presynaptic counterparts (D). Matured mushroom-like spines are marked by arrowheads. E, F, Double labeling of neuron for surface-expressed α7 and endogenous PSD-95. 3D reconstruction (E) from boxed region in F showed colocalization of α7 (green) and endogenous PSD-95 (red). Image stacks were scanned from a cell (22 DIV) transfected previously by α7. Note that the PSD-95 antibody stained transfected and nontransfected cells. Scale bars: (in D) A–D, 10 μm; (in F) E, 20 μm; F, 40 μm.
Figure 8.
Figure 8.
Synaptic locations of recombinant α4β2. A–F, Neurons transfected with tagged α7 (A) or α4β2 (B) were surface labeled with mouse anti-HA antibodies (red), followed by labeling with rabbit anti-synapsin antibodies at 16 DIV (green). C, D, Enlarged images from the boxed regions in A and B, respectively. Note that the clusters of α7 from the dendritic region were often in close contact with presynaptic clusters (C, arrowheads). Fractions of α4β2 clusters were also in close contact with presynaptic marker (D, arrowheads). Small regions ∼300 μm from the cell body in which axons were located were shown from α7-transfected cells (E) or α4β2-transfected cells (F). G, H, Neurons transfected at 8 DIV with tagged α7 (G) or α4β2 (H) plus PSD-95–GFP (middle) were surface labeled with anti-HA antibodies (top) at 14 DIV. A number of overlapped clusters were indicated by arrowheads (bottom). Within the somal area, PSD-95–GFP was observed in a perinuclear distribution, typical for intracellular proteins. Scale bars: (in B) A, B, 50 μm; (in D) C, D, 20 μm; (in F) E, F, 20 μm; (in H) G, H, 20 μm.
Figure 9.
Figure 9.
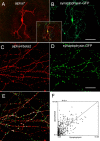
Comparisons of α7 and α4β2 with synaptophysin–EGFP (enhanced GFP). Neurons were transfected with recombinant neuronal nAChRs plus synaptophysin–GFP at 8 DIV. Surface receptors were labeled with mouse anti-HA antibodies at 16 DIV. α7 (A) did not overlap with synaptophysin–GFP (B), except for cell bodies (inset). Both α4β2 and synaptophysin–GFP were expressed along axons, although α4β2 was distributed more uniformly (C) than synaptophysin–GFP (D). More than 60% of the synaptophysin–GFP clusters were colocalized with α4β2 (E; colocalized clusters were labeled in white). The correlation coefficient was further calculated using ImageJ (CorrelationJ 1e plugin; F).
Figure 10.
Figure 10.
M3–M4 loops from nAChR subunits confer signals for subcellular targeting. Neurons were transfected at 8 DIV with CD4 (A–C), CD4–α4 (D–F), and CD4–α7 (G–I) plus GFP. Surface CD4 and CD4 fusion proteins were stained 4 d later with anti-CD4 antibody. GFP signals (left) labeled axons and dendrites of transfected cells. A–C, CD4 surface expression was not polarized. Arrowheads indicate axons. D–F, The M3–M4 loop from α4 promoted axonal distribution of fusion protein. Arrows indicate soma-dendrites. G–I, Ubiquitously expressed CD4 became polarized to dendrites after fusion with the M3–M4 loop from α7. Scale bars: (in F, I) A–I, 40 μm. J, Schematic representation of CD4 and the CD4/M3–M4 loop fusion proteins. K, Normalized D/A ratios of CD4 and the CD4/M3–M4 loop fusion proteins. Error bars are SEM.
Figure 11.
Figure 11.
Identification of motifs in M3–M4 loops from the nAChR α4 and α7 subunits that mediate targeted polarization in neurons. A, B, Series of C-terminal or N-terminal truncations or internal fragments of M3–M4 loops from α4 (A) or α7 (B) were fused to IL2RA. Red, black, and blue bars indicate “polarized surface expression,” “nonpolarized” (NP), and “not available” (NA), respectively. Relative ratios of polarization for each construct were also represented by + symbols, with +++ representing the most polarized and + representing slightly polarized. Low surface expression was observed from some constructs (A, B, right column); for most of these constructs, surface polarization ratios were labeled as NA because of the difficulties in image analysis. C, Sequence alignment of M3–M4 loops from α4, α7, and β2. The axonal sequence in α4 is highlighted in yellow, the dendritic signal of α7 is highlighted in pink, and the first 30 aa from β2, which abolishes surface expression, is highlighted in blue. D, Identified targeting sequences. Analysis of the surface distribution from fusion proteins defined a 25-residue sequence within α4 loops that governed axonal expression (residues 30–54) and a 48-residue segment from the α7 loop (residues 33–80) that was necessary for dendritic expression. Potential key targeting motifs within the identified segments are underlined, with the consensus motif marked above or below.
Figure 12.
Figure 12.
Identifications of key residues within the axonal and dendritic targeting motifs. A, Neurons were transfected at 8 DIV with CD4–α4 (top) and CD4–α4–LIE/AAA mutant (bottom) plus GFP (left). GFP signals labeled axons and dendrites of transfected cells. Surface CD4 and CD4 fusion proteins were stained 6 d later with anti-CD4 antibody (right). Note the absence of signals in soma-dendrites from CD4–α4 but not LIE/AAA mutants. B, Neurons were transfected at 8 DIV with α7–HA (top) and α7–LLY/AAA mutant (bottom) plus GFP (left). Surface receptors were stained 4 d later with anti-HA antibody (right). Note the absence of axonal signals from wild-type α7 but not LIE/AAA mutant. C, The dendrite/axon ratio of CD4–α4 was affected by the LIE/AAA mutation but not the FWP/AAA mutation. D, The dendrite/axon ratio of α7 was affected by mutations introduced in the dileucine and YXXφ motifs but not by the PRR/AAA mutation. ***p < 0.001; ** p < 0.05; t test. Error bars are SEM.
Figure 13.
Figure 13.
Axonal signal in α4 mediates fast dendritic endocytosis. Sister cultures were studied for surface axonal targeting mediated by α4 axonal sequences. Neurons were transfected with CD4–α4 at 8 DIV. Staining of surface CD4–α4 (A), total CD4–α4 (B), and endocytosed CD4–α4 (C) was performed at 12 DIV. Surface CD4–α4 was primarily found in axons (A; D/A, 0.09 ± 0.015), whereas total CD4–α4 was found equally in both axons and dendrites (B; D/A, 0.89 ± 0.65; n = 15). Endocytosis assay was performed by first exposing the cells to primary antibody for 30 min at 37°C, followed by the quick stripping of surface-bound receptor. The cells were then fixed, permeabilized, and stained with secondary antibody. Under these conditions, only internalized proteins were visualized. In contrast to the predominant display of surface protein on axons (A) and nonpolarized form for total protein (B), the majority of endocytosed signals were found in soma-dendrites with little in axons (C). Arrows indicate soma-dendrites. Arrowheads indicate axons. Scale bars, 50 μm.

Similar articles

Cited by

References

    1. Alkondon M, Albuquerque EX. Diversity of nicotinic acetylcholine receptors in rat hippocampal neurons. I. Pharmacological and functional evidence for distinct structural subtypes. J Pharmacol Exp Ther. 1993;265:1455–1473. - PubMed
    1. Alkondon M, Pereira EF, Barbosa CT, Albuquerque EX. Neuronal nicotinic acetylcholine receptor activation modulates gamma-aminobutyric acid release from CA1 neurons of rat hippocampal slices. J Pharmacol Exp Ther. 1997;283:1396–1411. - PubMed
    1. Alkondon M, Pereira EF, Eisenberg HM, Albuquerque EX. Choline and selective antagonists identify two subtypes of nicotinic acetylcholine receptors that modulate GABA release from CA1 interneurons in rat hippocampal slices. J Neurosci. 1999;19:2693–2705. - PMC - PubMed
    1. Alkondon M, Pereira EF, Almeida LE, Randall WR, Albuquerque EX. Nicotine at concentrations found in cigarette smokers activates and desensitizes nicotinic acetylcholine receptors in CA1 interneurons of rat hippocampus. Neuropharmacology. 2000;39:2726–2739. - PubMed
    1. Arroyo-Jiménez MM, Bourgeois JP, Marubio LM, Le Sourd AM, Ottersen OP, Rinvik E, Fairen A, Changeux JP. Ultrastructural localization of the α4-subunit of the neuronal acetylcholine nicotinic receptor in the rat substantia nigra. J Neurosci. 1999;19:6475–6487. - PMC - PubMed

Publication types

Substances