. 2006 Dec 15;577(Pt 3):971-84.
doi: 10.1113/jphysiol.2006.115394. Epub 2006 Sep 21.

Structural changes in the myosin filament and cross-bridges during active force development in single intact frog muscle fibres: stiffness and X-ray diffraction measurements

Affiliations

Structural changes in the myosin filament and cross-bridges during active force development in single intact frog muscle fibres: stiffness and X-ray diffraction measurements

E Brunello et al. J Physiol. .

Abstract

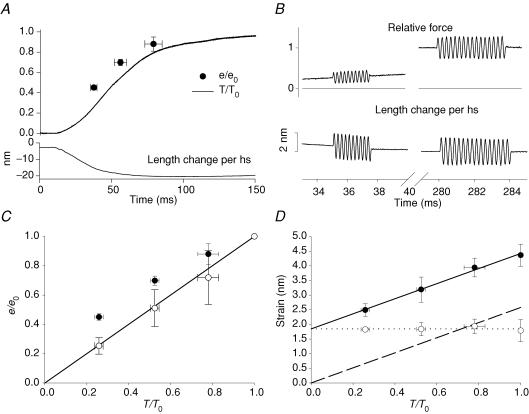
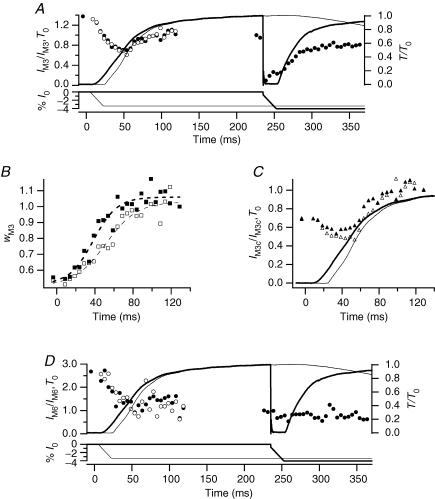
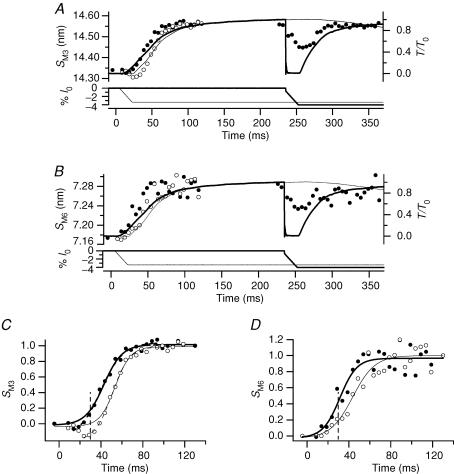
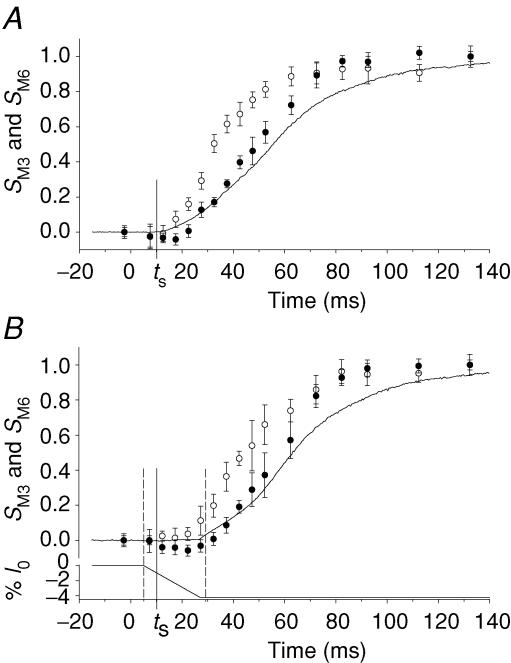
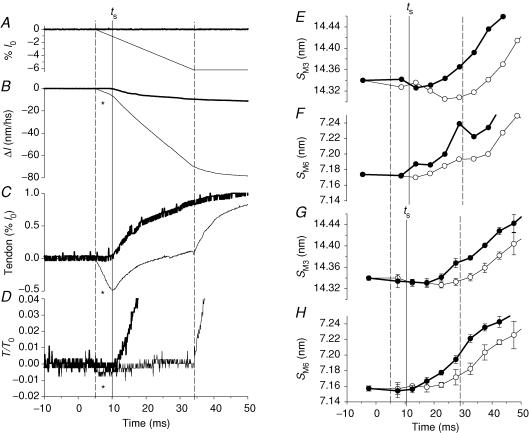
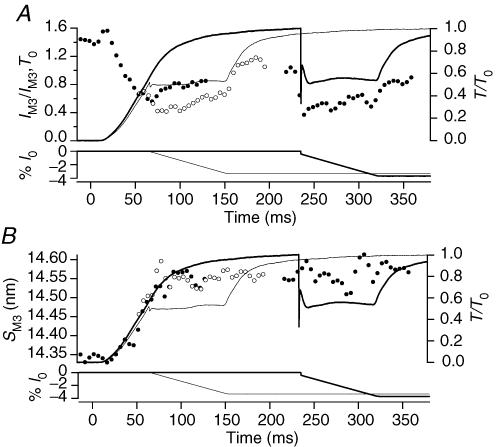
Structural and mechanical changes occurring in the myosin filament and myosin head domains during the development of the isometric tetanus have been investigated in intact frog muscle fibres at 4 degrees C and 2.15 microm sarcomere length, using sarcomere level mechanics and X-ray diffraction at beamline ID2 of the European Synchrotron Radiation Facility (Grenoble, France). The time courses of changes in both the M3 and M6 myosin-based reflections were recorded with 5 ms frames using the gas-filled RAPID detector (MicroGap Technology). Following the end of the latent period (11 ms after the start of stimulation), force increases to the tetanus plateau value (T(0)) with a half-time of 40 ms, and the spacings of the M3 and M6 reflections (S(M3) and S(M6)) increase by 1.5% from their resting values, with time courses that lead that of force by approximately 10 and approximately 20 ms, respectively. These temporal relations are maintained when the increase of force is delayed by approximately 10 ms by imposing, from 5 ms after the first stimulus, 50 nm (half-sarcomere)(-1) shortening at the velocity (V(0)) that maintains zero force. Shortening at V(0) transiently reduces S(M3) following the latent period and delays the subsequent increase in S(M3), but only delays the S(M6) increase without a transient decrease. Shortening at V(0) imposed at the tetanus plateau causes an abrupt reduction of the intensity of the M3 reflection (I(M3)), whereas the intensity of the M6 reflection (I(M6)) is only slightly reduced. The changes in half-sarcomere stiffness indicate that the isometric force at each time point is proportional to the number of myosin heads bound to actin. The different sensitivities of the intensity and spacing of the M3 and M6 reflections to the mechanical responses support the view that the M3 reflection in active muscle originates mainly from the myosin heads attached to the actin filament and the M6 reflection originates mainly from a fixed structure in the myosin filament signalling myosin filament length changes during the tetanus rise.


Figures

Figure 1
Figure 1. Stiffness and strain of the half-sarcomere during the rise of the isometric tetanus
A, time course of force (T, thick line), stiffness (e, •) and half-sarcomere shortening (nm, thin line) during the tetanus rise. Force and stiffness are relative to the tetanic plateau values T0 and e0, respectively. Zero time is the start of stimulation. B, force (relative to T0) and length change per half-sarcomere (nm) during 4 kHz sinusoidal length changes imposed 35 ms and 280 ms after the start of stimulation when force was 0.25 T0 and T0. C, half-sarcomere stiffness (•) and cross-bridge stiffness (○) plotted against the force developed during the tetanus rise. Cross-bridge stiffness is calculated from the open circles in D as explained in the text. The line represents the direct proportionality between stiffness and force. D, half-sarcomere strain (•) plotted against force; the slope of the straight line fitted to these points (2.6 ± 0.1 nm T0−1) represents the filament strain (dashed line). Cross-bridge strain (○) obtained by subtracting filament strain from half-sarcomere strain. Dotted line is the linear regression of these data.
Figure 2
Figure 2. X-ray intensity changes during the rise of the tetanus and during unloaded shortening
In each panel filled symbols refer to X-ray data collected in tetani with the unloaded shortening imposed at the isometric plateau; open symbols refer to X-ray data collected in tetani with unloaded shortening imposed 5 ms after the start of stimulation. Data were collected on the RAPID detector with 5 ms time frames. Zero time is the start of stimulation. A, circles, intensity of M3 reflection (IM3) relative to the plateau value; lines, force (relative to T0, upper traces) and imposed length changes (% of fibre length (l0), lower traces). Thick lines, tetanus with unloaded shortening imposed at the plateau; thin lines, unloaded shortening imposed at 5 ms after the start of stimulation. B, squares, cross-meridional width of the M3 reflection (wM3), relative to the isometric plateau value, during tetanus rise. Dashed lines, sigmoid fits to the data. C, triangles, time course of IM3 after width correction (IM3c=IM3×wM3). Continuous lines, force traces as in A. D, circles, intensity of M6 reflection (IM6) relative to the plateau value; lines, force and length traces as in A.
Figure 3
Figure 3. Spacing changes during the tetanus rise and during unloaded shortening
Same experiments as Fig. 2. A and B, spacings of M3 and M6 reflections, SM3 and SM6, respectively. Thick and thin lines, and filled and open circles according to the description in Fig. 2A. C. fractional change in SM3 between rest and tetanus plateau. Continuous lines, sigmoid fits to data lying above 0; dashed lines, sigmoid fit to data starting from the lowest value. In the isometric tetanus (thick lines), the half-time for SM3 is 31.3 ± 1.6 ms for the continuous line and 30.9 ± 1.4 ms for the dashed line. In the tetanus with initial shortening (thin lines), the half-time for SM3 is 42.2 ± 1.4 ms for the continuous line and 42.2 ± 1.3 ms for the dashed line. The vertical dashed line marks the end of unloaded shortening. D, fractional change in SM6 between rest and tetanus plateau. Continuous lines, sigmoid fit to data. Vertical dashed line, end of unloaded shortening.
Figure 4
Figure 4. Effect of unloaded shortening on the time course of SM3 and SM6 changes during the tetanus rise
X-ray patterns collected with FReLoN detector. Fractional spacing changes (mean ±s.d. from n = 3 fibres) between rest and tetanus plateau. In both A and B the continuous line is the force. Zero time is the start of stimulation. The vertical continuous lines indicate ts. A, SM3 (•) and SM6 (○) during the rise of the isometric tetanus. B, SM3 (•) and SM6 (○) in tetani with V0 shortening imposed 5 ms after the start of stimulation. Traces are force (upper) and imposed length change (lower). Vertical dashed lines mark the boundary of the average duration of unloaded shortening.
Figure 5
Figure 5. Mechanical and structural signals at the onset of contraction
In all the frames the vertical continuous line marks ts, the dashed lines mark the boundary of the period of unloaded shortening. AD, thick line, isometric condition; thin line, unloaded shortening imposed 5 ms after the start of stimulation. A, fibre length change imposed by the motor; shortening in %l0, where l0 is the fibre length. B, length change in nm per half-sarcomere (Δl) measured in the selected fibre segment. Note that during the first 5 ms of imposed shortening (denoted by *), the half-sarcomere shortens at a velocity lower than V0; V0 shortening starts 10 ms after the first stimulus, at the end of the latent period, when in the isometric contraction the half-sarcomere starts to shorten against the end compliance. C, difference between fibre length change in A and half-sarcomere length change in B, both expressed in %l0 (where l0 for B is the half-sarcomere length). D, force. E and F, SM3 and SM6 from RAPID experiments in isometric conditions (•) and during the imposed V0 shortening (○). G and H, SM3 and SM6 from FReLoN experiments. Same symbols as in E and F.
Figure 6
Figure 6. Effect of shortening at ¼V0 on IM3 (A) and SM3 (B)
Filled circles, X-ray data collected in tetani with ¼V0 shortening imposed at the isometric plateau (thick lines); open circles, X-ray data collected in tetani with ¼V0 shortening imposed 65 ms after the start of stimulation (thin lines). Data collected on the RAPID detector. In each panel lower traces are the imposed length changes (%l0) and upper traces the corresponding force responses (relative to T0).

References

    1. Bagni MA, Cecchi G, Cecchini E, Colombini B, Colomo F. Force responses to fast ramp stretches in stimulated frog skeletal muscle fibres. J Muscle Res Cell Motil. 1998;19:33–42. - PubMed
    1. Bagni MA, Cecchi G, Colomo F, Garzella P. Absence of mechanical evidence for attached weakly binding cross-bridges in frog relaxed muscle fibres. J Physiol. 1995;482:391–400. - PMC - PubMed
    1. Bordas J, Diakun GP, Diaz FG, Harries JE, Lewis RA, Lowy J, Mant GR, Martin-Fernandez ML, Towns-Andrews E. Two-dimensional time-resolved X-ray diffraction studies of live isometrically contracting frog sartorius muscle. J Muscle Res Cell Motil. 1993;14:311–324. - PubMed
    1. Cecchi G, Colomo F, Lombardi V. Force-velocity relation in normal and nitrate-treated frog single muscle fibres during rise of tension in an isometric tetanus. J Physiol. 1978;285:257–273. - PMC - PubMed
    1. Cecchi G, Colomo F, Lombardi V, Piazzesi G. Stiffness of frog muscle fibres during rise of tension and relaxation in fixed-end or length-clamped tetani. Pflugers Arch. 1987;409:39–46. - PubMed

Publication types

LinkOut - more resources