S100A4 accelerates tumorigenesis and invasion of human prostate cancer through the transcriptional regulation of matrix metalloproteinase 9
- PMID: 16990429
- PMCID: PMC1595436
- DOI: 10.1073/pnas.0606747103
S100A4 accelerates tumorigenesis and invasion of human prostate cancer through the transcriptional regulation of matrix metalloproteinase 9
Abstract
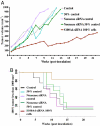
We previously showed that the calcium-binding protein S100A4 is overexpressed during the progression of prostate cancer (CaP) in humans and in the TRAMP (transgenic adenocarcinoma of the mouse prostate) mouse model. We tested a hypothesis that the S100A4 gene plays a role in the invasiveness of human CaP and may be associated with its metastatic spread. We observed that siRNA-mediated suppression of the S100A4 gene significantly reduced the proliferative and invasive capability of the highly invasive CaP cells PC-3. We evaluated the mechanism through which the S100A4 gene controls invasiveness of cells by using a macroarray containing 96 well characterized metastatic genes. We found that matrix metalloproteinase 9 (MMP-9) and its tissue inhibitor (TIMP-1) were highly responsive to S100A4 gene suppression. Furthermore, S100A4 suppression significantly reduced the expression and proteolytic activity of MMP-9. By employing an MMP-9-promoter reporter, we observed a significant reduction in the transcriptional activation of the MMP-9 gene in S100A4-siRNA-transfected cells. Cells overexpressing the S100A4 gene (when transfected with pcDNA3.1-S100A4 plasmid) also significantly expressed MMP-9 and TIMP-1 genes with increased proteolytic activity of MMP-9 concomitant to increased transcriptional activation of the MMP-9 gene. S100A4-siRNA-transfected cells exhibited a reduced rate of tumor growth under in vivo conditions. Our data demonstrate that the S100A4 gene controls the invasive potential of human CaP cells through regulation of MMP-9 and that this association may contribute to metastasis of CaP cells. We suggest that S100A4 could be used as a biomarker for CaP progression and a novel therapeutic or chemopreventive target for human CaP treatment.
Conflict of interest statement
The authors declare no conflict of interest.
Figures


Similar articles
-
Knockdown of S100A4 decreases tumorigenesis and metastasis in osteosarcoma cells by repression of matrix metalloproteinase-9.Asian Pac J Cancer Prev. 2011;12(8):2075-80. Asian Pac J Cancer Prev. 2011. PMID: 22292654
-
S100A4 regulates migration and invasion in hepatocellular carcinoma HepG2 cells via NF-κB-dependent MMP-9 signal.Eur Rev Med Pharmacol Sci. 2013 Sep;17(17):2372-82. Eur Rev Med Pharmacol Sci. 2013. PMID: 24065232 Clinical Trial.
-
S100A4 involvement in metastasis: deregulation of matrix metalloproteinases and tissue inhibitors of matrix metalloproteinases in osteosarcoma cells transfected with an anti-S100A4 ribozyme.Cancer Res. 1999 Sep 15;59(18):4702-8. Cancer Res. 1999. PMID: 10493528
-
Calcium-binding protein S100A4 in health and disease.Biochim Biophys Acta. 1998 Dec 10;1448(2):190-9. doi: 10.1016/s0167-4889(98)00143-8. Biochim Biophys Acta. 1998. PMID: 9920410 Review.
-
Wnt up your mind - intervention strategies for S100A4-induced metastasis in colon cancer.Gen Physiol Biophys. 2009;28 Spec No Focus:F55-64. Gen Physiol Biophys. 2009. PMID: 20093727 Review.
Cited by
-
Targeting TGF-β1 inhibits invasion of anaplastic thyroid carcinoma cell through SMAD2-dependent S100A4-MMP-2/9 signalling.Am J Transl Res. 2016 May 15;8(5):2196-209. eCollection 2016. Am J Transl Res. 2016. PMID: 27347327 Free PMC article.
-
A multiplexed, targeted mass spectrometry assay of the S100 protein family uncovers the isoform-specific expression in thyroid tumours.BMC Cancer. 2015 Mar 29;15:199. doi: 10.1186/s12885-015-1217-x. BMC Cancer. 2015. PMID: 25880590 Free PMC article.
-
EMMPRIN is associated with S100A4 and predicts patient outcome in colorectal cancer.Br J Cancer. 2012 Aug 7;107(4):667-74. doi: 10.1038/bjc.2012.293. Epub 2012 Jul 10. Br J Cancer. 2012. PMID: 22782346 Free PMC article.
-
Overexpression of Dishevelled-2 contributes to proliferation and migration of human esophageal squamous cell carcinoma.J Mol Histol. 2016 Jun;47(3):287-95. doi: 10.1007/s10735-016-9674-3. Epub 2016 Apr 15. J Mol Histol. 2016. PMID: 27083564
-
Dihydromyricetin Inhibited Migration and Invasion by Reducing S100A4 Expression through ERK1/2/β-Catenin Pathway in Human Cervical Cancer Cell Lines.Int J Mol Sci. 2022 Dec 1;23(23):15106. doi: 10.3390/ijms232315106. Int J Mol Sci. 2022. PMID: 36499426 Free PMC article.
References
-
- Jemal A, Siegel R, Ward E, Murray T, Xu J, Smigal C, Thun MJ. CA Cancer J Clin. 2006;56:106–130. - PubMed
-
- Klein EA, Thompson IM. Curr Opin Urol. 2004;14:143–149. - PubMed
-
- Saleem M, Adhami VM, Zhong W, Longley BJ, Lin CY, Dickson RB, Reagan-Shaw S, Jarrard DF, Mukhtar H. Cancer Epidemiol Biomarkers Prev. 2006;5:217–227. - PubMed
-
- Heizmann CW. Methods Mol Biol. 2002;172:69–80. - PubMed
Publication types
MeSH terms
Substances
Grants and funding
LinkOut - more resources
Full Text Sources
Other Literature Sources
Medical
Research Materials
Miscellaneous

