

Predicting interpretability of metabolome models based on behavior, putative identity, and biological relevance of explanatory signals
- PMID: 16990432
- PMCID: PMC1595442
- DOI: 10.1073/pnas.0605152103
Predicting interpretability of metabolome models based on behavior, putative identity, and biological relevance of explanatory signals
Abstract
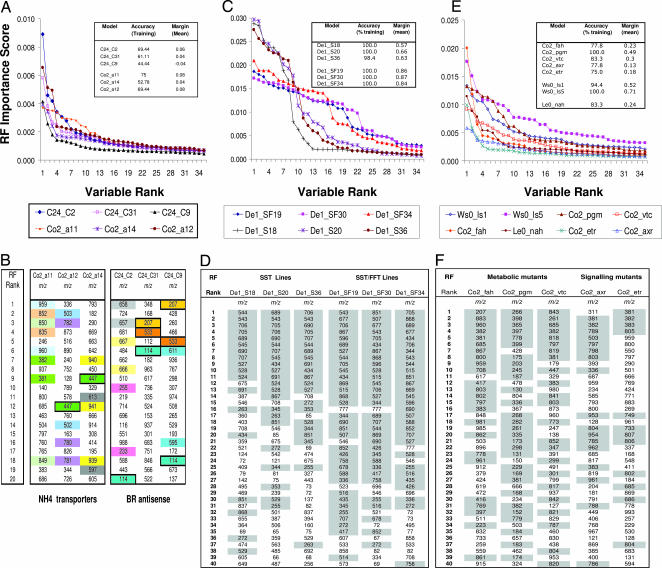
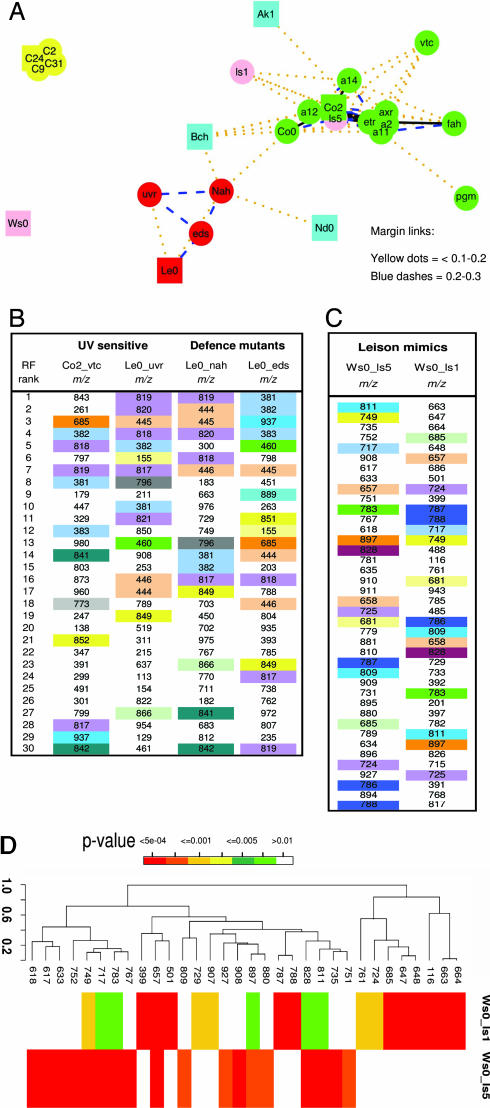
Powerful algorithms are required to deal with the dimensionality of metabolomics data. Although many achieve high classification accuracy, the models they generate have limited value unless it can be demonstrated that they are reproducible and statistically relevant to the biological problem under investigation. Random forest (RF) generates models, without any requirement for dimensionality reduction or feature selection, in which individual variables are ranked for significance and displayed in an explicit manner. In metabolome fingerprinting by mass spectrometry, each metabolite can be represented by signals at several m/z. Exploiting a prior understanding of expected biochemical differences between sample classes, we aimed to develop meaningful metrics relevant to the significance both of the overall RF model and individual, potentially explanatory, signals. Pair-wise comparison of related plant genotypes with strong phenotypic differences demonstrated that robust models are not only reproducible but also logically structured, highlighting correlated m/z derived from just a small number of explanatory metabolites reflecting the biological differences between sample classes. RF models were also generated by using groupings of samples known to be increasingly phenotypically similar. Although classification accuracy was often reasonable, we demonstrated reproducibly in both Arabidopsis and potato a performance threshold based on margin statistics beyond which such models showed little structure indicative of either generalizability or further biological interpretability. In a multiclass problem using 25 Arabidopsis genotypes, despite the complicating effects of ecotype background and secondary metabolome perturbations common to several mutations, the ranking of metabolome signals by RF provided scope for deeper interpretability.
Conflict of interest statement
The authors declare no conflict of interest.
Figures

References
-
- Dunn WB, Bailey NJC, Johnson HE. Analyst. 2005;130:606–625. - PubMed
-
- Bino RJ, Hall RD, Fiehn O, Kopka J, Saito K, Draper J, Nikolau BJ, Mendes P, Roessner-Tunali U, Beale MH, et al. Trends Plant Sci. 2004;9:418–425. - PubMed
-
- Dunn WB, Overy S, Quick WP. Metabolomics. 2005;1:137–148.
-
- Somorjai RL, Dolenko B, Baumgartner R. Bioinformatics. 2003;12:1484–1491. - PubMed
Publication types
MeSH terms
LinkOut - more resources
Full Text Sources
