. 2006 Oct;3(10):825-31.
doi: 10.1038/nmeth931.

State-based discovery: a multidimensional screen for small-molecule modulators of EGF signaling

Affiliations

State-based discovery: a multidimensional screen for small-molecule modulators of EGF signaling

Mark Sevecka et al. Nat Methods. 2006 Oct.

Abstract

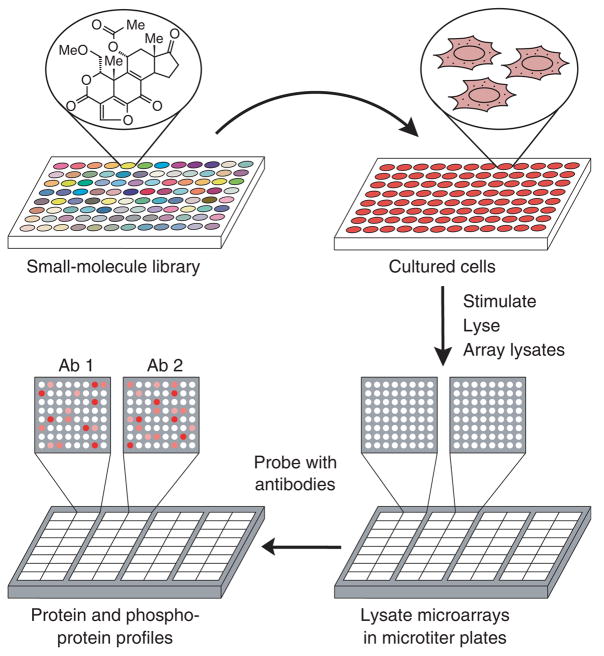
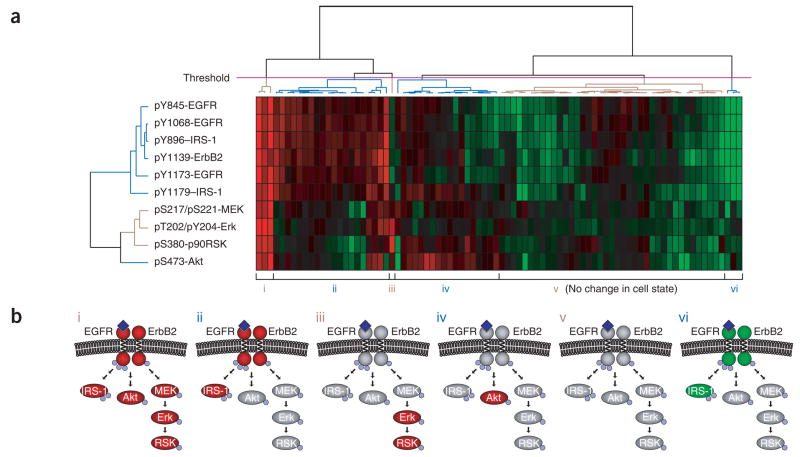
As an alternative to conventional, target-oriented drug discovery, we report a strategy that identifies compounds on the basis of the state that they induce in a signaling network. Immortalized human cells are grown in microtiter plates and treated with compounds from a small-molecule library. The target network is then activated and lysates derived from each sample are arrayed onto glass-supported nitrocellulose pads. By probing these microarrays with antibodies that report on the abundance or phosphorylation state of selected proteins, a global picture of the target network is obtained. As proof of concept, we screened 84 kinase and phosphatase inhibitors for their ability to induce different states in the ErbB signaling network. We observed functional connections between proteins that match our understanding of ErbB signaling, indicating that state-based screens can be used to define the topology of signaling networks. Additionally, compounds sort according to the multidimensional phenotypes they induce, suggesting that state-based screens may inform efforts to identify the targets of biologically active small molecules.


Conflict of interest statement

COMPETING INTERESTS STATEMENT

The authors declare that they have no competing financial interests.

Figures

Figure 1
Figure 1
State-based screening using lysate microarrays. Cells are grown in 96-well microtiter plates, treated with small molecules (one compound per well), stimulated with a growth factor, and lysed. The resulting lysates are arrayed onto glass-supported nitrocellulose pads and the arrays are assembled into a microtiter-plate format. Each array is probed with a different pan- or phosphorylation-specific antibody, yielding a quantitative snapshot of the state of the signaling network induced by each small molecule.
Figure 2
Figure 2
Evaluation of antibodies for use in lysate microarrays. (a) Antibody to pY1173-EGFR shows no significant cross-reactivity on lysate microarrays. (b) Antibody to pT308-Akt antibody shows only nonspecific signals on lysate microarrays. (c) Antibody to EGFR shows some cross-reactivity on lysate microarrays, resulting in compressed signal ratios relative to the immunoblots. Cellular lysates were analyzed at one concentration on immunoblots (top) and at seven different concentrations on lysate microarrays (twofold dilution series; middle). Lysates in a and b were derived from A431 cells stimulated for different durations with 200 ng/ml of EGF; lysates in c were derived from six cancer cell lines. Quantitative data from the immunoblots and the lysate microarrays were normalized relative to their respective mean values and compared (bottom).
Figure 3
Figure 3
Lysate microarrays resulting from a state-based screen of 84 kinase and phosphatase inhibitors. (a) A 2.5 × 7.5 cm glass slide with 16 identical lysate microarrays probed with eight different antibodies. Arrays probed with antibodies to pY1173-EGFR and to pT202/pY204-Erk are highlighted. (b) Enlarged views of microarrays shown in a. Top, array probed with antibody to pY1173-EGFR; bottom, array probed with antibody to pT202/pY204-Erk. Locations of lysates derived from cells treated with U-0126 and AG-1478 are highlighted. The EGFR inhibitor AG-1478 causes a decrease in the EGF-induced phosphorylation of EGFR and Erk, whereas the MEK inhibitor U-0126 causes a decrease in phosphorylation of Erk but does not affect that of EGFR. The layout of each microarray is shown in bottom right.
Figure 4
Figure 4
Clustering of data from a state-based screen. (a) Heat map obtained by hierarchical clustering of relative inhibition values for each small-molecule–antigen pair. Positive inhibition values, indicating a decrease in phosphorylation, range from 0 (black; no inhibition) to 1 (red; 100% inhibition). Negative inhibition values, indicating an increase in phosphorylation, range from 0 (black; no inhibition) to −1 (green; twofold increase in phosphorylation). (b) Simplified view of the six network states defined by the threshold (magenta line) shown in a. Red ovals represent proteins with decreased phosphorylation; green ovals represent proteins with increased phosphorylation; gray ovals represent proteins whose phosphorylation was unaffected. Small blue spheres represent sites of phosphorylation. Dark blue diamonds represent EGF bound to the extracellular domain of EGFR.
Figure 5
Figure 5
Dose-response curves determined with lysate microarrays. (a) MEK inhibitor U-0126; (b) PI3K inhibitor LY294002. For each antibody, normalized intensity values and fit curves were scaled relative to the maximum and minimum asymptotic values of the fit. Error bars represent the s.d. from three replicate wells.

References

    1. Blume-Jensen P, Hunter T. Oncogenic kinase signalling. Nature. 2001;411:355–365. - PubMed
    1. Ohashi PS. T-cell signalling and autoimmunity: molecular mechanisms of disease. Nat Rev Immunol. 2002;2:427–438. - PubMed
    1. Casalini P, Iorio MV, Galmozzi E, Menard S. Role of HER receptors family in development and differentiation. J Cell Physiol. 2004;200:343–350. - PubMed
    1. Perlman ZE, et al. Multidimensional drug profiling by automated microscopy. Science. 2004;306:1194–1198. - PubMed
    1. Perez OD, Nolan GP. Simultaneous measurement of multiple active kinase states using polychromatic flow cytometry. Nat Biotechnol. 2002;20:155–162. - PubMed

Publication types

MeSH terms