

Potential role of natural killer cells in controlling growth and infiltration of AIDS-associated primary effusion lymphoma cells
- PMID: 16995875
- PMCID: PMC11158791
- DOI: 10.1111/j.1349-7006.2006.00319.x
Potential role of natural killer cells in controlling growth and infiltration of AIDS-associated primary effusion lymphoma cells
Abstract
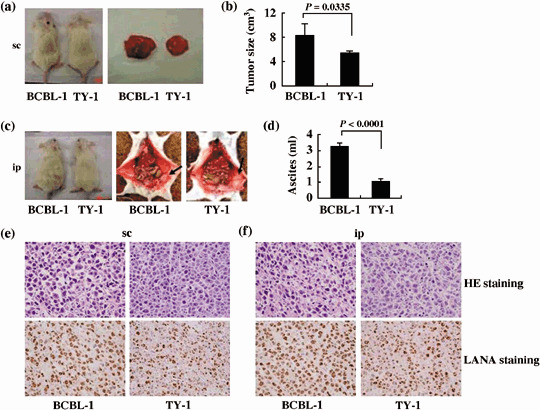
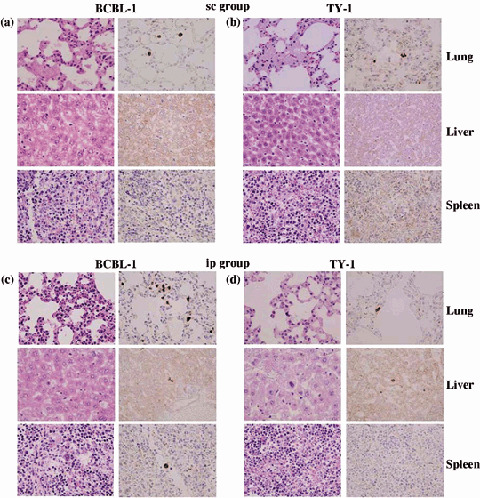
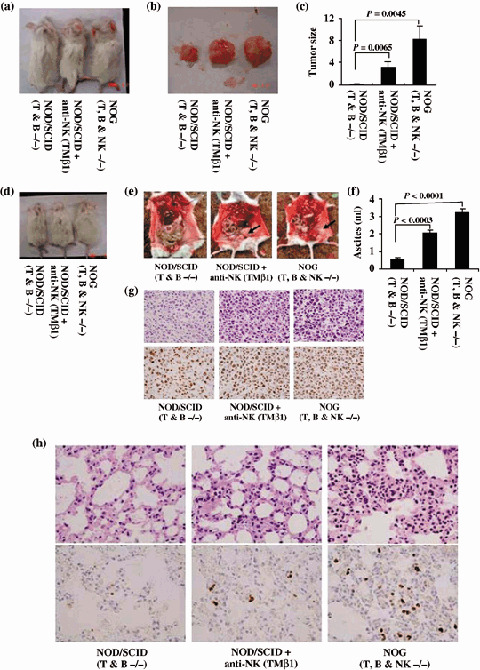
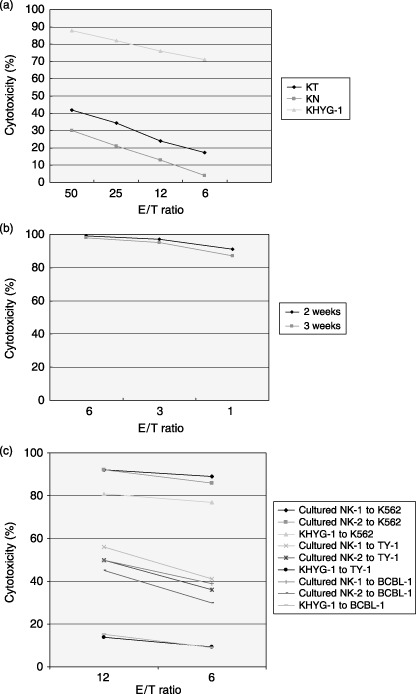
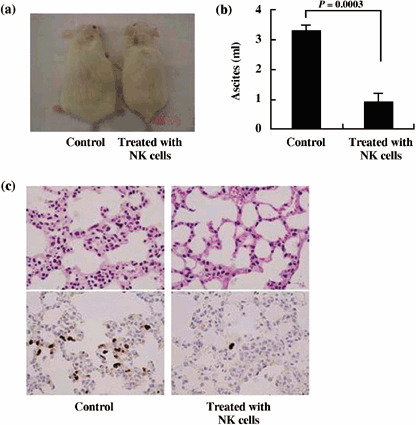
Natural killer (NK) cells are an important component of the innate immune response against microbial infections and tumors. Direct involvement of NK cells in tumor growth and infiltration has not yet been demonstrated clearly. Primary effusion lymphoma (PEL) cells were able to produce tumors and ascites very efficiently with infiltration of cells in various organs of T-, B- and NK-cell knock-out NOD/SCID/gammac(null) (NOG) mice within 3 weeks. In contrast, PEL cells formed small tumors at inoculated sites in T- and B-cell knock-out NOD/SCID mice with NK-cells while completely failing to infiltrate into various organs. Immunosupression of NOD/SCID by treatment with an antimurine TM-beta1 antibody, which transiently abrogates NK cell activity in vivo, resulted in enhanced tumorigenicity and organ infiltration in comparison with non-treated NOD/SCID mice. Activated human NK cells inhibited tumor growth and infiltration in NOG mice. Our results suggest that NK cells play an important role in growth and infiltration of PEL cells, and activated NK cells could be a promising immunotherapeutic tool against tumor or virus-infected cells either alone or in combination with conventional therapy. The rapid and efficient engraftment of PEL cells in NOG mice also suggests that this new animal model could provide a unique opportunity to understand and investigate the mechanism of pathogenesis and malignant cell growth.
Figures
Similar articles
-
Role of natural killer cells in hormone-independent rapid tumor formation and spontaneous metastasis of breast cancer cells in vivo.Breast Cancer Res Treat. 2007 Sep;104(3):267-75. doi: 10.1007/s10549-006-9416-4. Epub 2006 Oct 26. Breast Cancer Res Treat. 2007. PMID: 17066321
-
Rapid tumor formation of human T-cell leukemia virus type 1-infected cell lines in novel NOD-SCID/gammac(null) mice: suppression by an inhibitor against NF-kappaB.J Virol. 2003 May;77(9):5286-94. doi: 10.1128/jvi.77.9.5286-5294.2003. J Virol. 2003. PMID: 12692230 Free PMC article.
-
Proliferation of functional human natural killer cells with anti-HIV-1 activity in NOD/SCID/Jak3(null) mice.Microbiol Immunol. 2016 Feb;60(2):106-13. doi: 10.1111/1348-0421.12355. Microbiol Immunol. 2016. PMID: 26708420
-
Lymphoma cell lines: in vitro models for the study of HHV-8+ primary effusion lymphomas (body cavity-based lymphomas).Leukemia. 1998 Oct;12(10):1507-17. doi: 10.1038/sj.leu.2401160. Leukemia. 1998. PMID: 9766492 Review.
-
Natural killer cells in breast cancer cell growth and metastasis in SCID mice.Biomed Pharmacother. 2005 Oct;59 Suppl 2:S375-9. doi: 10.1016/s0753-3322(05)80082-4. Biomed Pharmacother. 2005. PMID: 16507413 Review.
Cited by
-
Efficacy of ex vivo activated and expanded natural killer cells and T lymphocytes for colorectal cancer patients.Biomed Rep. 2014 Jul;2(4):505-508. doi: 10.3892/br.2014.264. Epub 2014 Mar 26. Biomed Rep. 2014. PMID: 24944796 Free PMC article.
-
Proceedings of the Annual Symposium & Plenary Session on Regenerative Medicine (PASRM).J Stem Cells Regen Med. 2012 Nov 26;8(3):203-9. doi: 10.46582/jsrm.0803014. eCollection 2012. J Stem Cells Regen Med. 2012. PMID: 24874956 Free PMC article. No abstract available.
-
How can we establish animal models of HIV-associated lymphoma?Animal Model Exp Med. 2024 Aug;7(4):484-496. doi: 10.1002/ame2.12409. Epub 2024 Apr 3. Animal Model Exp Med. 2024. PMID: 38567763 Free PMC article. Review.
-
Development of functional human NK cells in an immunodeficient mouse model with the ability to provide protection against tumor challenge.PLoS One. 2009 Dec 21;4(12):e8379. doi: 10.1371/journal.pone.0008379. PLoS One. 2009. PMID: 20027308 Free PMC article.
-
Establishment of an efficient ex vivo expansion strategy for human natural killer cells stimulated by defined cytokine cocktail and antibodies against natural killer cell activating receptors.Regen Ther. 2022 Jul 21;21:185-191. doi: 10.1016/j.reth.2022.07.001. eCollection 2022 Dec. Regen Ther. 2022. PMID: 35919498 Free PMC article.
References
-
- Jaffe ES, Harris NL, Stein H, Vardiman JW, eds. World Health Organization Classification of Tumors, Pathology and Genetics of Tumors of Haematopoietic and Lymphoid Tissues. Lyon, France: IARC Press, 2001.
-
- Gaidano G, Carbone A. Primary effusion lymphoma: a liquid phase lymphoma of fluid‐filled body cavities. Adv Cancer Res 2001; 80: 115–46. - PubMed
-
- Cesarman E, Knowles DM. The role of Kaposi's sarcoma‐associated herpesvirus (KSHV/HHV‐8) in lymphoproliferative diseases. Semin Cancer Biol 1999; 9: 165–74. - PubMed
-
- Klein U, Gloghini A, Gaidano G et al. Gene expression profile analysis of AIDS‐related primary effusion lymphoma (PEL) suggests a plasmablastic derivation and identifies PEL‐specific transcripts. Blood 2003; 102: 4115–21. - PubMed
-
- Cesarman E, Chang Y, Moore PS, Said JW, Knowles DM. Kaposi's sarcoma‐associated herpesvirus‐like DNA sequences in AIDS‐related body‐cavity‐based lymphomas. N Engl J Med 1995; 332: 1186–91. - PubMed
Publication types
MeSH terms
LinkOut - more resources
Full Text Sources
Medical
