Differentiation between electron transport sensing and proton motive force sensing by the Aer and Tsr receptors for aerotaxis
- PMID: 16995896
- PMCID: PMC1858650
- DOI: 10.1111/j.1365-2958.2006.05411.x
Differentiation between electron transport sensing and proton motive force sensing by the Aer and Tsr receptors for aerotaxis
Abstract
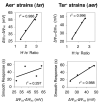
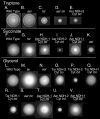
Aerotaxis (oxygen-seeking) behaviour in Escherichia coli is a response to changes in the electron transport system and not oxygen per se. Because changes in proton motive force (PMF) are coupled to respiratory electron transport, it is difficult to differentiate between PMF, electron transport or redox, all primary candidates for the signal sensed by the aerotaxis receptors, Aer and Tsr. We constructed electron transport mutants that produced different respiratory H+/e- stoichiometries. These strains expressed binary combinations of one NADH dehydrogenase and one quinol oxidase. We then introduced either an aer or tsr mutation into each mutant to create two sets of electron transport mutants. In vivo H+/e- ratios for strains grown in glycerol medium ranged from 1.46+/-0.18-3.04+/-0.47, but rates of respiration and growth were similar. The PMF jump in response to oxygen was proportional to the H+/e- ratio in each set of mutants (r2=0.986-0.996). The length of Tsr-mediated aerotaxis responses increased with the PMF jump (r2=0.988), but Aer-mediated responses did not correlate with either PMF changes (r2=0.297) or the rate of electron transport (r2=0.066). Aer-mediated responses were linked to NADH dehydrogenase I, although there was no absolute requirement. The data indicate that Tsr responds to changes in PMF, but strong Aer responses to oxygen are associated with redox changes in NADH dehydrogenase I.
Figures


Similar articles
-
The Aer protein and the serine chemoreceptor Tsr independently sense intracellular energy levels and transduce oxygen, redox, and energy signals for Escherichia coli behavior.Proc Natl Acad Sci U S A. 1997 Sep 30;94(20):10541-6. doi: 10.1073/pnas.94.20.10541. Proc Natl Acad Sci U S A. 1997. PMID: 9380671 Free PMC article.
-
Aer and Tsr guide Escherichia coli in spatial gradients of oxidizable substrates.Microbiology (Reading). 2003 Sep;149(Pt 9):2661-2667. doi: 10.1099/mic.0.26304-0. Microbiology (Reading). 2003. PMID: 12949190
-
Behavioral responses of Escherichia coli to changes in redox potential.Proc Natl Acad Sci U S A. 1996 Sep 17;93(19):10084-9. doi: 10.1073/pnas.93.19.10084. Proc Natl Acad Sci U S A. 1996. PMID: 8816755 Free PMC article.
-
Aerotaxis and other energy-sensing behavior in bacteria.Annu Rev Microbiol. 1999;53:103-28. doi: 10.1146/annurev.micro.53.1.103. Annu Rev Microbiol. 1999. PMID: 10547687 Review.
-
Aer on the inside looking out: paradigm for a PAS-HAMP role in sensing oxygen, redox and energy.Mol Microbiol. 2007 Sep;65(6):1415-24. doi: 10.1111/j.1365-2958.2007.05889.x. Mol Microbiol. 2007. PMID: 17824925 Free PMC article. Review.
Cited by
-
Identification of Aerotaxis Receptor Proteins Involved in Host Plant Infection by Pseudomonas syringae pv. tabaci 6605.Microbes Environ. 2022;37(1):ME21076. doi: 10.1264/jsme2.ME21076. Microbes Environ. 2022. PMID: 35264479 Free PMC article.
-
Structure-function relationships in the HAMP and proximal signaling domains of the aerotaxis receptor Aer.J Bacteriol. 2008 Mar;190(6):2118-27. doi: 10.1128/JB.01858-07. Epub 2008 Jan 18. J Bacteriol. 2008. PMID: 18203838 Free PMC article.
-
Salmonella enterica Serovar Typhimurium Strategies for Host Adaptation.Front Microbiol. 2017 Oct 12;8:1983. doi: 10.3389/fmicb.2017.01983. eCollection 2017. Front Microbiol. 2017. PMID: 29075247 Free PMC article. Review.
-
Aer Receptors Influence the Pseudomonas chlororaphis PCL1606 Lifestyle.Front Microbiol. 2020 Jul 8;11:1560. doi: 10.3389/fmicb.2020.01560. eCollection 2020. Front Microbiol. 2020. PMID: 32754135 Free PMC article.
-
Demethylmenaquinone Methyl Transferase Is a Membrane Domain-Associated Protein Essential for Menaquinone Homeostasis in Mycobacterium smegmatis.Front Microbiol. 2018 Dec 18;9:3145. doi: 10.3389/fmicb.2018.03145. eCollection 2018. Front Microbiol. 2018. PMID: 30619211 Free PMC article.
References
-
- Adler J. Chemotaxis in bacteria. Science. 1966;153:708–716. - PubMed
-
- Adler J. A method for measuring chemotaxis and use of the method to determine optimum conditions for chemotaxis by Escherichia coli. J Gen Microbiol. 1973;74:77–91. - PubMed
-
- Adler J. Chemotaxis in bacteria. Annu Rev Biochem. 1975;44:341–356. - PubMed
-
- Anraku Y, Gennis RB. The aerobic respiratory chain of Escherichia coli. Trends Biochem Sci. 1987;12:262–266.
Publication types
MeSH terms
Substances
Grants and funding
LinkOut - more resources
Full Text Sources
Molecular Biology Databases

