. 2006 Oct 3;103(40):14907-12.
doi: 10.1073/pnas.0606176103. Epub 2006 Sep 22.

Bim and Bad mediate imatinib-induced killing of Bcr/Abl+ leukemic cells, and resistance due to their loss is overcome by a BH3 mimetic

Affiliations

Bim and Bad mediate imatinib-induced killing of Bcr/Abl+ leukemic cells, and resistance due to their loss is overcome by a BH3 mimetic

Junya Kuroda et al. Proc Natl Acad Sci U S A. .

Erratum in

Abstract

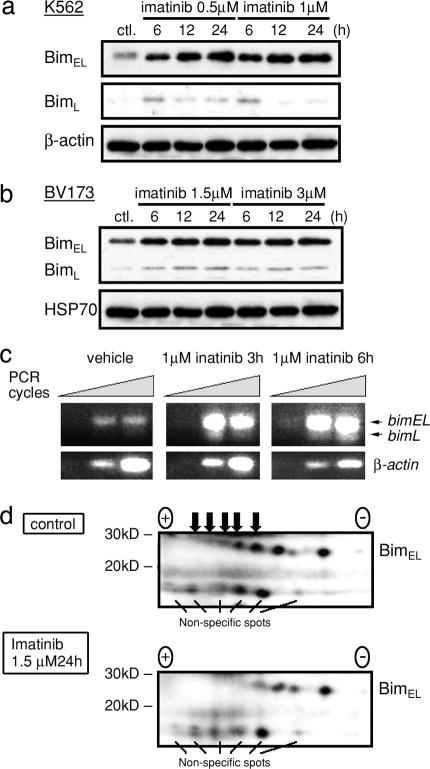
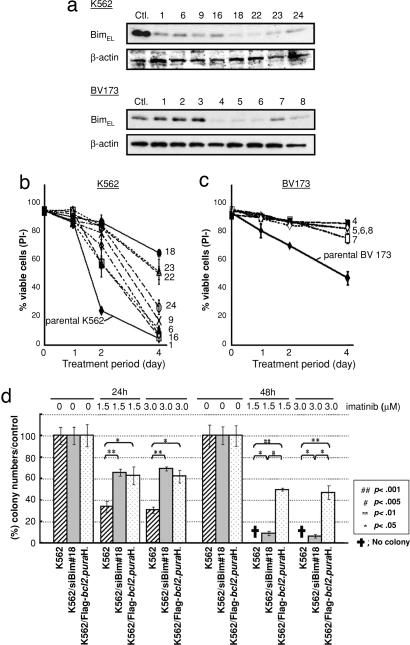
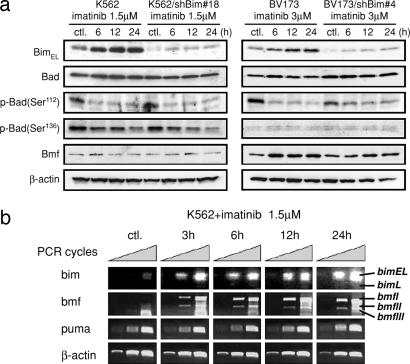
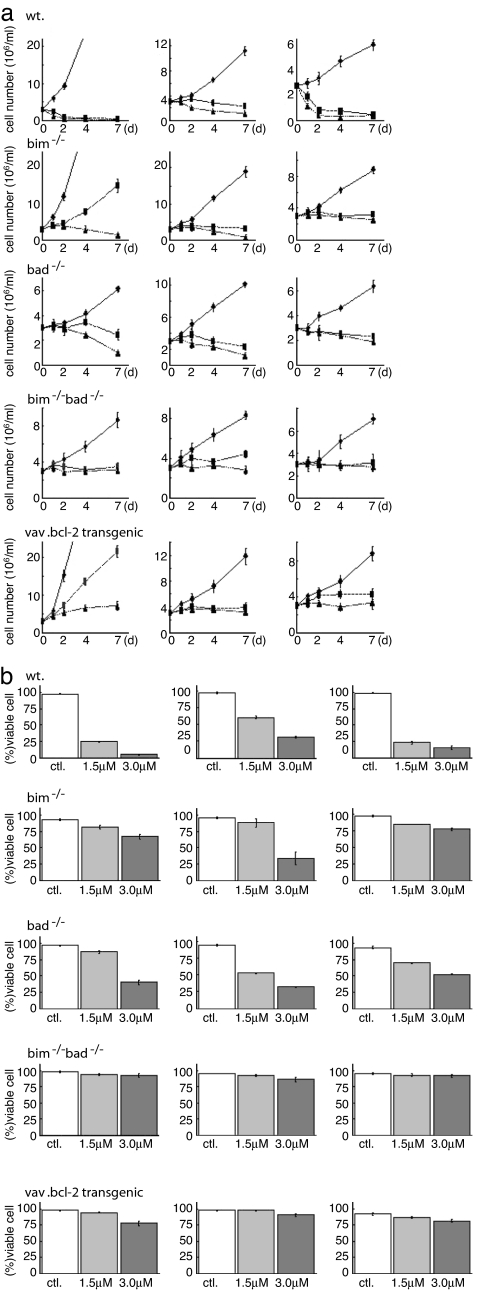
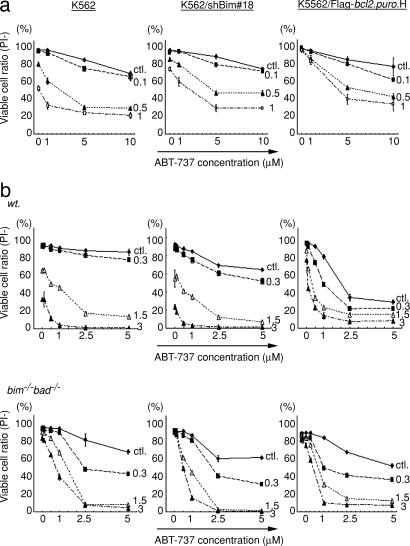
Cell killing is a critical pharmacological activity of imatinib to eradicate Bcr/Abl+ leukemias. We found that imatinib kills Bcr/Abl+ leukemic cells by triggering the Bcl-2-regulated apoptotic pathway. Imatinib activated several proapoptotic BH3-only proteins: bim and bmf transcription was increased, and both Bim and Bad were activated posttranslationally. Studies using RNAi and cells from gene-targeted mice revealed that Bim plays a major role in imatinib-induced apoptosis of Bcr/Abl+ leukemic cells and that the combined loss of Bim and Bad abrogates this killing. Loss of Bmf or Puma had no effect. Resistance to imatinib caused by Bcl-2 overexpression or loss of Bim (plus Bad) could be overcome by cotreatment with the BH3 mimetic ABT-737. These results demonstrate that Bim and Bad account for most, perhaps all, imatinib-induced killing of Bcr/Abl+ leukemic cells and suggest previously undescribed drug combination strategies for cancer therapy.


Conflict of interest statement

The authors declare no conflict of interest.

Figures

Fig. 1.
Fig. 1.
Treatment with imatinib induces increased Bim expression and Bim dephosphorylation in Ph1+ human leukemic cells. K562 cells (a) or BV173 cells (b) were treated for the indicated amount of time with the indicated doses of imatinib. Western blotting was performed with an anti-Bim antibody and as a loading control with antibodies to HSP70 or β-actin. (c) K562 cells were treated for 3 or 6 h with 1 μM imatinib. Semiquantitative RT-PCR was performed to determine levels of bim mRNA (cycles: 25, 30, and 35). Semiquantitative RT-PCR for β-actin mRNA was used as a control (cycles: 20, 25, and 30). (d) K562 cells were left untreated or were treated for 24 h with 1.5 μM imatinib. Bim proteins were purified on an anti-Bim antibody affinity column and then analyzed by 2D gel electrophoresis. Arrows indicate the position of highly phosphorylated Bim from untreated cells.
Fig. 2.
Fig. 2.
Bim knockdown by RNAi protects K562 and BV173 cells against imatinib-induced killing. (a) Western blot analysis by using antibodies to Bim documents the levels of Bim expression in parental (Ctl, control) and RNAi Bim knockdown subclones of K562 and BV173 cells. Probing with an antibody to β-actin was used as a loading control. (b and c) Parental and RNAi Bim knockdown subclones of K562 and BV173 cells were treated for the indicated amount of time with 1.5 μM (b) or 3 μM (c) imatinib. Cell viability was determined by staining with propidium iodide (PI) followed by flow cytometric analysis. (d) Parental and RNAi Bim knockdown subclones of K562 cells were treated for 24 or 48 h with 0 (DMSO carrier alone), 1.5, or 3 μM imatinib. Cells then were washed free of drug and plated in agar to measure frequency of colony formation. Data represent means ± SD of three experiments indicating percentage of colony formation compared with untreated cells.
Fig. 3.
Fig. 3.
Effect of imatinib on expression of Bim, Bad, and Bmf and phosphorylation of Bad in parental and Bim knockdown K562 and BV173 cells. (a) Parental or Bim knockdown (RNAi-mediated) K562 and BV173 cells were treated for the indicated periods of time with 1.5 μM or 3 μM imatinib, respectively. Western blotting was performed by using antibodies to Bim, (total) Bad, phosphorylated Bad, Bmf, or β-actin (loading control). (b) Semiquantitative RT-PCR analysis was performed to determine the levels of bim (cycles: 25, 30, and 35), bmf (cycles: 25, 30, and 35), puma (cycles: 30, 35, and 40) and β-actin (loading control; cycles: 20, 25, and 30) mRNA in K562 cells that had been treated for 3, 6, 12, or 24 h with 1.5 μM imatinib or with vehicle control (DMSO).
Fig. 4.
Fig. 4.
Loss of Bim, Bad, or Bcl-2 overexpression protects bcr-abl transformed murine myeloid progenitors against imatinib-induced death. Wt, bim−/−, bad−/−, bim−/−bad−/−, or vav-bcl-2 transgenic fetal liver-derived myeloid progenitors transformed with bcr-abl (three independent lines from three separate mice for each genotype) were treated with vehicle (DMSO; solid line) or 1.5 (dashed line) or 3 μM imatinib (dotted line), and cell growth (a) was scored after 1, 2, 4, and 7 days. Data represent means ± SD of three independent experiments. (b) Cell viability was assessed after 7 days of treatment with 1.5 or 3 μM imatinib by staining with trypan blue dye and counting in a hemocytometer. Results represent means ± SD of three independent experiments indicating percentage of viable cells normalized to percentage of viable cells in control (DMSO)-treated cells.
Fig. 5.
Fig. 5.
The BH3 mimetic ABT-737 sensitizes Ph1+ human leukaemia cells and bcr-abl transformed mouse myeloid progenitors to imatinib-induced killing. (a) Parental Bcl-2 overexpressing (high levels; see Fig. 6 df) and Bim knockdown (clone 18) K562 cells were treated with carrier (DMSO; ●), 0.1 (■), 0.5 (▴), or 1 μM (□) imatinib, 1, 5, or 10 μM ABT-737, or both drugs (at all possible combinations). After 48 h of culture, cell survival was measured by propidium iodide (PI) staining and FACS analysis. (b) Three independently derived WT and bim−/−bad−/− bcr-abl transformed fetal liver-derived myeloid progenitor lines were treated with carrier (DMSO; ◆), 0.3 (■), 1.5 (▵), or 3 μM (▴) imatinib, 0.5, 1, 2.5, or 5 μM ABT-737, or both drugs (at all possible combinations). After 24 h of culture cell, survival was measured by PI staining and FACS analysis.

Comment in

Similar articles

Cited by

References

    1. Deininger M, Buchdunger E, Druker BJ. Blood. 2005;105:2640–2653. - PubMed
    1. Bhatia R, Holtz M, Niu N, Gray R, Snyder DS, Sawyers CL, Arber DA, Slovak ML, Forman SJ. Blood. 2003;101:4701–4707. - PubMed
    1. Strasser A, O'Connor L, Dixit VM. Annu Rev Biochem. 2000;69:217–245. - PubMed
    1. Green DR, Kroemer G. Science. 2004;305:626–629. - PubMed
    1. Puthalakath H, Strasser A. Cell Death Differ. 2002;9:505–512. - PubMed

Publication types

MeSH terms