

Global map of growth-regulated gene expression in Burkholderia pseudomallei, the causative agent of melioidosis
- PMID: 16997946
- PMCID: PMC1698202
- DOI: 10.1128/JB.01006-06
Global map of growth-regulated gene expression in Burkholderia pseudomallei, the causative agent of melioidosis
Abstract
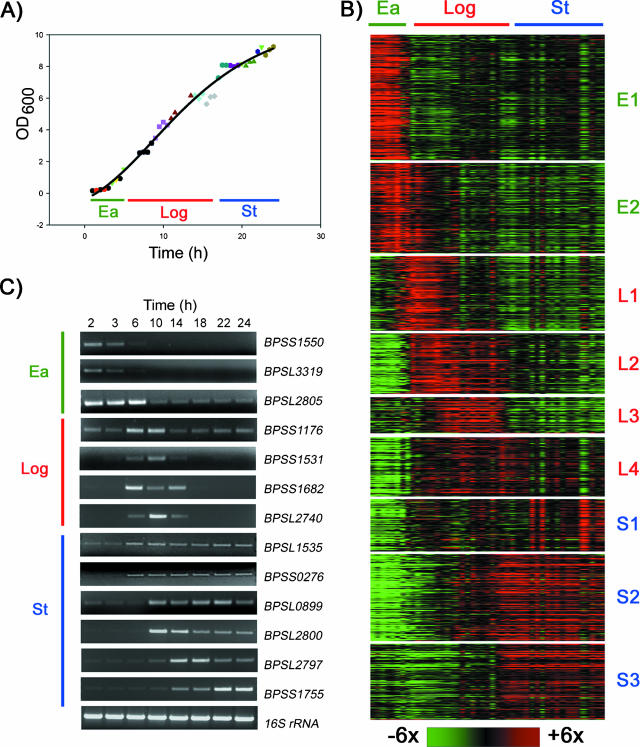
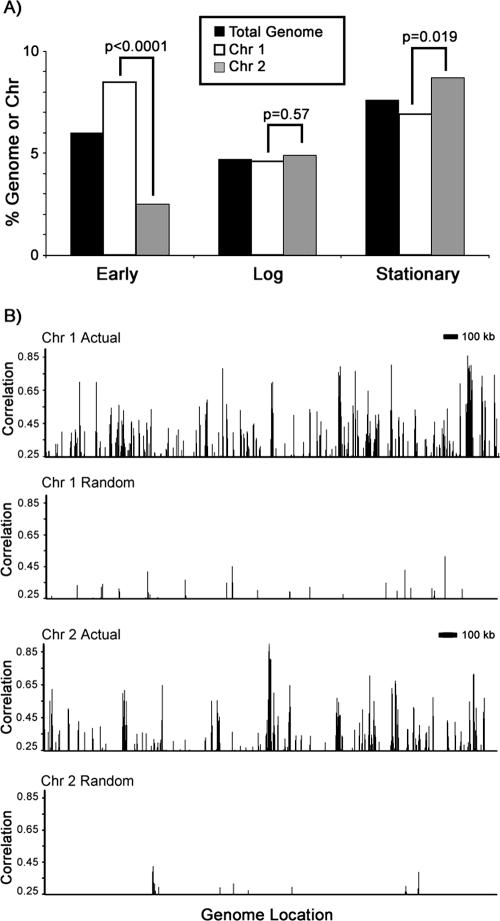
Many microbial pathogens express specific virulence traits at distinct growth phases. To understand the molecular pathways linking bacterial growth to pathogenicity, we have characterized the growth transcriptome of Burkholderia pseudomallei, the causative agent of melioidosis. Using a fine-scale sampling approach, we found approximately 17% of all B. pseudomallei genes displaying regulated expression during growth in rich medium, occurring as broad waves of functionally coherent gene expression tightly associated with distinct growth phases and transition points. We observed regulation of virulence genes across all growth phases and identified serC as a potentially new virulence factor by virtue of its coexpression with other early-phase virulence genes. serC-disrupted B. pseudomallei strains were serine auxotrophs and in mouse infection assays exhibited a dramatic attenuation of virulence compared to wild-type B. pseudomallei. Immunization of mice with serC-disrupted B. pseudomallei also conferred protection against subsequent challenges with different wild-type B. pseudomallei strains. At a genomic level, early-phase genes were preferentially localized on chromosome 1, while stationary-phase genes were significantly biased towards chromosome 2. We detected a significant level of chromosomally clustered gene expression, allowing us to predict approximately 100 potential operons in the B. pseudomallei genome. We computationally and experimentally validated these operons by showing that genes in these regions are preferentially transcribed in the same 5'-->3' direction, possess significantly shorter intergenic lengths than the overall genome, and are expressed as a common mRNA transcript. The availability of this transcriptome map provides an important resource for understanding the transcriptional architecture of B. pseudomallei.
Figures

Similar articles
-
Interrogation of the Burkholderia pseudomallei genome to address differential virulence among isolates.PLoS One. 2014 Dec 23;9(12):e115951. doi: 10.1371/journal.pone.0115951. eCollection 2014. PLoS One. 2014. PMID: 25536074 Free PMC article.
-
A proteasome inhibitor produced by Burkholderia pseudomallei modulates intracellular growth.Microb Pathog. 2017 Jun;107:175-180. doi: 10.1016/j.micpath.2017.03.015. Epub 2017 Mar 18. Microb Pathog. 2017. PMID: 28323151
-
Genome-wide expression analysis of Burkholderia pseudomallei infection in a hamster model of acute melioidosis.Infect Immun. 2006 Oct;74(10):5465-76. doi: 10.1128/IAI.00737-06. Infect Immun. 2006. PMID: 16988221 Free PMC article.
-
Advances and remaining uncertainties in the epidemiology of Burkholderia pseudomallei and melioidosis.Trans R Soc Trop Med Hyg. 2008 Mar;102(3):225-7. doi: 10.1016/j.trstmh.2007.11.005. Epub 2007 Dec 31. Trans R Soc Trop Med Hyg. 2008. PMID: 18166205 Review.
-
Type III Secretion in the Melioidosis Pathogen Burkholderia pseudomallei.Front Cell Infect Microbiol. 2017 Jun 15;7:255. doi: 10.3389/fcimb.2017.00255. eCollection 2017. Front Cell Infect Microbiol. 2017. PMID: 28664152 Free PMC article. Review.
Cited by
-
Identification and application of a growth-regulated promoter for improving L-valine production in Corynebacterium glutamicum.Microb Cell Fact. 2018 Nov 24;17(1):185. doi: 10.1186/s12934-018-1031-7. Microb Cell Fact. 2018. PMID: 30474553 Free PMC article.
-
The condition-dependent transcriptional landscape of Burkholderia pseudomallei.PLoS Genet. 2013;9(9):e1003795. doi: 10.1371/journal.pgen.1003795. Epub 2013 Sep 12. PLoS Genet. 2013. PMID: 24068961 Free PMC article.
-
Correlates of immune protection following cutaneous immunization with an attenuated Burkholderia pseudomallei vaccine.Infect Immun. 2013 Dec;81(12):4626-34. doi: 10.1128/IAI.00915-13. Epub 2013 Oct 7. Infect Immun. 2013. PMID: 24101688 Free PMC article.
-
Hypothetical Protein BPSL3393 of Burkholderia pseudomallei is Involved in Ethanolamine Catabolism.Trop Life Sci Res. 2017 Jul;28(2):57-74. doi: 10.21315/tlsr2017.28.2.5. Epub 2017 Jul 31. Trop Life Sci Res. 2017. PMID: 28890761 Free PMC article.
-
Temporal transcriptomic microarray analysis of "Dehalococcoides ethenogenes" strain 195 during the transition into stationary phase.Appl Environ Microbiol. 2008 May;74(9):2864-72. doi: 10.1128/AEM.02208-07. Epub 2008 Feb 29. Appl Environ Microbiol. 2008. PMID: 18310438 Free PMC article.
References
-
- Anuntagool, N., P. Intachote, V. Wuthiekanun, N. J. White, and S. Sirisinha. 1998. Lipopolysaccharide from nonvirulent Ara+ Burkholderia pseudomallei isolates is immunologically indistinguishable from lipopolysaccharide from virulent Ara− clinical isolates. Clin. Diagn. Lab. Immunol. 5:225-229. - PMC - PubMed
-
- Atkins, T., R. G. Prior, K. Mack, P. Russell, M. Nelson, P. C. F. Oyston, G. Dougan, and R. W. Titball. 2002. A mutant of Burkholderia pseudomallei, auxotrophic in the branched-chain amino acid biosynthetic pathway, is attenuated and protective in a murine model of melioidosis. Infect. Immun. 70:5290-5294. - PMC - PubMed
Publication types
MeSH terms
Substances
Associated data
- Actions
LinkOut - more resources
Full Text Sources
Molecular Biology Databases
