. 2006;34(18):5175-83.
doi: 10.1093/nar/gkl654. Epub 2006 Sep 22.

Mechanisms of transcriptional regulation underlying temporal integration of signals

Affiliations

Mechanisms of transcriptional regulation underlying temporal integration of signals

Dominique A Glauser et al. Nucleic Acids Res. 2006.

Abstract

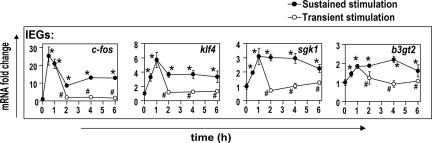
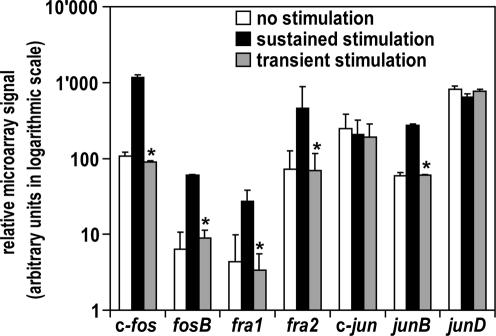
How cells convert the duration of signals into differential adaptation of gene expression is a poorly understood issue. Signal-induced immediate-early gene (IEG) expression couples early signals to late expression of downstream <target> genes. Here we study how kinetic features of the IEG-<target> system allow temporal integration of stimuli in a pancreatic beta cell model of metabolic stimulation. Gene expression profiling revealed that beta cells produce drastically different transcriptional outputs in response to different stimuli durations. Noteworthy, most genes (87%) regulated by a sustained stimulation (4 h) were not regulated by a transient stimulation (1 h followed by 3 h without stimulus). We analyzed the induction kinetics of several previously identified IEGs and <targets>. IEG expression persisted as long as stimulation was maintained, but was rapidly lost upon stimuli removal, abolishing the delayed <target> induction. The molecular mechanisms coupling the duration of stimuli to quantitative <target> transcription were demonstrated for the AP-1 transcription factor. In conclusion, we propose that the network composed of IEGs and their <targets> dynamically functions to convert signal inputs of different durations into quantitative differences in global transcriptional adaptation. These findings provide a novel and more comprehensive view of dynamic gene regulation.


Figures

Figure 1
Figure 1
Metabolic stimulations of different durations produce different global transcriptional outputs. (A) Schematic representation of the two types of stimulations (sustained and transient) used for the expression profiling experiment. (B) Venn diagram representing the number of genes regulated by sustained stimulation, by transient stimulation, and by both. Expression profiles were determined using the Affymetrix Mouse Genome 430 2.0 oligonucleotide array (comprising probes for ∼45 000 transcripts). Regulated genes were determined by comparing each stimulated condition with an unstimulated control condition for which cells were maintained in preincubation medium at 1 mM glucose throughout.
Figure 2
Figure 2
Validation of gene expression profiling by RT-PCR. mRNA levels for indicated genes were assessed by quantitative real-time RT-PCR and normalized with 18S rRNA. Results are expressed as mean of fold change compared to control condition (SD as error bars, n = 5). Comparison with sustained stimulation by Student t-test: *, P < 0.01; #, P < 0.05; NS, non significant.
Figure 3
Figure 3
Kinetics of IEG expression during sustained or transient metabolic stimulation. Min6 cells cultured at low glucose were stimulated with high glucose (10 mM) and cpt-cAMP (0.2 mM) for the indicated period of time. For transient stimulation, medium was replaced with low glucose medium after 1 h of stimulation. mRNA levels for indicated genes were quantified by real-time RT-PCR and results expressed as mean (±SD) of fold change values relative to basal condition (n = 3). *, P < 0.05 versus basal condition; #, P < 0.05 versus sustained stimulation at the corresponding time point, by Student t-test.
Figure 4
Figure 4
Steady-state expression levels of IEGs are adjusted according to glucose concentration. Min6 cells were cultured at indicated glucose concentrations for 20 h. mRNA levels for indicated genes were assessed by quantitative real-time RT-PCR and normalized with 18S rRNA. Results are expressed as mean of fold change compared to control condition (±SD, n = 3).
Figure 5
Figure 5
Kinetics of <target> gene expression during sustained or transient metabolic stimulation. Min6 cells cultured at low glucose were stimulated with high glucose (10 mM) and cpt-cAMP (0.2 mM) for the indicated period of time. For transient stimulation, medium was replaced with low glucose medium after 1 h of stimulation. mRNA levels for indicated genes were quantified by real-time RT-PCR and results expressed as mean (±SD) of fold change values relative to basal condition (n = 3). *, P < 0.05 versus basal condition; #, P < 0.05 versus sustained stimulation at the corresponding time point, by Student t-test.
Figure 6
Figure 6
Expression pattern of AP-1 component genes is modulated according to the length of stimulation. A schematic representation of the two stimulation protocols—sustained or transient—is shown in Figure 1A. Data shown are selected from the expression profiling experiment summarized in Figure 1B. Expression profiles were determined using the Affymetrix Mouse Genome 430 2.0 oligonucleotide array. Shown are the means of gene-expression values obtained in the indicated condition, represented on a logarithmic scale (with SD as error bars, n = 3). *, P < 0.01 versus sustained stimulation, by Student t-test.
Figure 7
Figure 7
Upon the withdrawal of metabolic stimuli c-FOS protein rapidly disappears from AP-1 complexes, reducing AP-1-dependent reporter gene transcription. (A) Min6 cells cultured at low glucose were stimulated with high glucose (10 mM) and cpt-cAMP (0.2 mM) and harvested after indicated period of time. Nuclear extracts were analyzed by immuno-blotting for c-FOS protein or TFIIB (loading control). (B) Cells cultured at low glucose were stimulated with 10 mM glucose and 10 nM GLP-1 and collected at 1 or 3 h for the preparation of nuclear extracts. c-FOS and JUND protein in AP-1 complexes bound to solid phase tethered dsDNA with AP-1 consensus sequence were quantified by ELISA. For transient stimulation, cells were stimulated 1 h followed by 2 h in low glucose medium. (C) Schematic representation of pAP-1-luc reporter gene. (D) Min6 cells were transfected with pAP-1-luc (or control vector) and maintained at low glucose before stimulation with 10 mM glucose and 0.2 mM cpt-cAMP for 6 h (sustained), or for 1 h followed by 5 h at low glucose (transient). *, P < 0.01 (n = 4), by Student t-test. Error bars: SD.
Figure 8
Figure 8
Gradual differences in stimuli duration result in distinct kinetic patterns of c-fos expression and produce gradual differences in the transcript level of the c-fos target gene srxn1. Min6 cells were co-stimulated with 10 mM glucose and 0.2 mM cpt-cAMP (at time 0), and gene expression was measured every hour over a period of 4 h. c-fos and srxn1 mRNA levels were quantified by RT-PCR and results were normalized with 18S rRNA. Three types of stimulations of graded durations were used: first, a short stimulation (a transient stimulation of 1 h followed by 3 h without stimulus); second, an intermediate stimulation (a transient stimulation of 160 min followed by 80 min without stimulus) third, a long stimulation (sustained stimulation throughout the 4 h). (A) Kinetic of c-fos induction with the different stimulation protocol, presented as mean values (n = 3; SD below 24% of the mean values). (B) Area Under Curve (AUC) calculated between 1 and 4 h from (A). (C) Relative srxn1 mRNA levels at the end of experiment (4 h), shown as mean values (n = 3; ±SD).
Figure 9
Figure 9
Model for signal integration by the IEG-<target> transcriptional system.

References

    1. Blenis J. Signal transduction via the MAP kinases: proceed at your own RSK. Proc. Natl Acad. Sci. USA. 1993;90:5889–5892. - PMC - PubMed
    1. Herschman H.R. Primary response genes induced by growth factors and tumor promoters. Annu. Rev. Biochem. 1991;60:281–319. - PubMed
    1. Hazzalin C.A., Mahadevan L.C. MAPK-regulated transcription: a continuously variable gene switch? Nature Rev. Mol. Cell. Biol. 2002;3:30–40. - PubMed
    1. Bhalla U.S., Iyengar R. Emergent properties of networks of biological signaling pathways. Science. 1999;283:381–387. - PubMed
    1. Gromada J., Holst J.J., Rorsman P. Cellular regulation of islet hormone secretion by the incretin hormone glucagon-like peptide 1. Pflugers Arch. 1998;435:583–594. - PubMed

Publication types