. 2006 Nov;24(11):1429-35.
doi: 10.1038/nbt1246. Epub 2006 Sep 24.

Compact, universal DNA microarrays to comprehensively determine transcription-factor binding site specificities

Affiliations

Compact, universal DNA microarrays to comprehensively determine transcription-factor binding site specificities

Michael F Berger et al. Nat Biotechnol. 2006 Nov.

Abstract

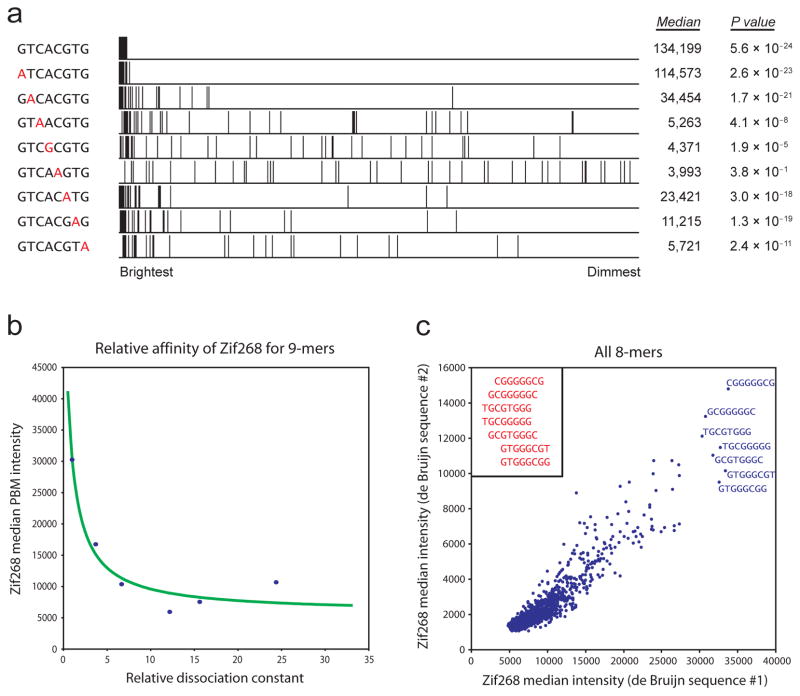
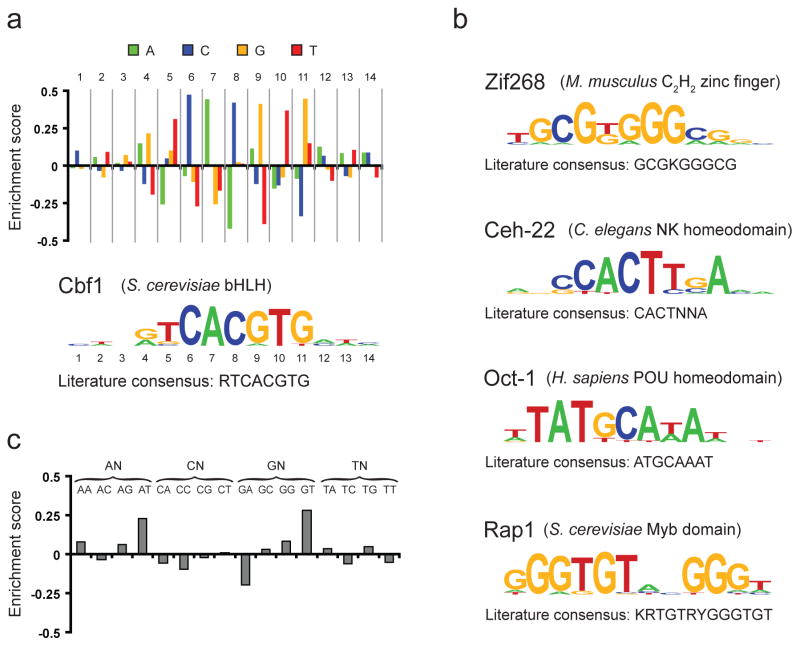
Transcription factors (TFs) interact with specific DNA regulatory sequences to control gene expression throughout myriad cellular processes. However, the DNA binding specificities of only a small fraction of TFs are sufficiently characterized to predict the sequences that they can and cannot bind. We present a maximally compact, synthetic DNA sequence design for protein binding microarray (PBM) experiments that represents all possible DNA sequence variants of a given length k (that is, all 'k-mers') on a single, universal microarray. We constructed such all k-mer microarrays covering all 10-base pair (bp) binding sites by converting high-density single-stranded oligonucleotide arrays to double-stranded (ds) DNA arrays. Using these microarrays we comprehensively determined the binding specificities over a full range of affinities for five TFs of different structural classes from yeast, worm, mouse and human. The unbiased coverage of all k-mers permits high-throughput interrogation of binding site preferences, including nucleotide interdependencies, at unprecedented resolution.


Figures

Figure 1
Figure 1
Design of a universal microarray for PBM experiments. (a) Overlapping k-mers. Each sequence on the microarray contains several distinct, overlapping k-mer binding sites. Here, k = 10. (b) Example of a de Bruijn sequence of order 3. A de Bruijn sequence of order 3 contains all 64 3-mer variants exactly once. The de Bruijn sequence is partitioned into subsequences that overlap by 2 bases, preserving all 3-mers in the sequence. These subsequences then become the spots on the microarray. (c) Universal PBM containing all possible 10-mer binding sites, bound by the S. cerevisiae TF Cbf1 expressed with a glutathione S-transferase (GST) epitope tag. At top is a schematic showing the three main stages of each experiment: primer annealing, primer extension, and protein binding. Beneath are zoom-in images of each stage for the same microarray, scanned at different wavelengths: Cy5-labeled universal primer, Cy3-labeled dUTP, and Alexa488-conjugated α-GST antibody. Fluorescence intensities are shown in false color, with blue indicating low signal intensity, green indicating moderate signal intensity, yellow indicating high signal intensity, and white indicating saturated signal intensity. The variability observed in the Cy3-dUTP signal is due to differences in the nucleotide composition of each feature. The blank spots are single-stranded negative control probes that do not contain the universal primer sequence.
Figure 2
Figure 2
Relating PBM signal intensity to individual k-mers. (a) Enrichment of different Cbf1 binding site variants. All spots are ranked in descending order by their normalized signal intensities, and spots containing a match to each specified 8-mer are marked. For each 8-mer, the median intensity over all such spots is shown (in fluorescence units), as is the P value for enrichment as calculated by the Wilcoxon-Mann-Whitney test. (b) Correspondence between signal intensity and binding affinity. The median intensities for six 9-mer binding site variants for the mouse TF Zif268 are plotted against their relative dissociation constants as measured by a quantitative binding (QuMFRA) assay. Data points are fit as described previously, with the addition of a constant term for nonspecific binding. (c) Correspondence between separate PBM experiments performed on microarrays constructed with independent de Bruijn sequences. The median intensity for spots containing a match to each 8-mer is shown for each experiment. As evident here, the PBM data are consistent not only for the highest-affinity k-mers but also for the moderate- and low-affinity k-mers. The observed correlation for 8-mers (R2 = 0.803) is only slightly weaker than for 7-mers (R2 = 0.890; Supplementary Fig. 6) yet considerably stronger than for 9-mers (R2 = 0.525). Each non-palindromic 8-mer is present on at least 32 spots, compared to 128 and 8 spots for 7-mers and 9-mers, respectively. Differences in the absolute scales reflect differences in scanning intensities. The highest-affinity k-mers are labeled and manually aligned (inset).
Figure 3
Figure 3
Determination of motifs and logos for five TFs. (a) Method of constructing PWMs and sequence logos, using Cbf1 as an example. First, all 8-mers containing up to three gapped positions are evaluated using our enrichment score (see Methods), and the highest-scoring 8-mer (in this case GTCACGTG) is used as a seed for constructing the motif. Second, at each position within this 8-mer seed, all four possible nucleotides are compared by inspecting the ranks of the probes matching each of the four variants. This analysis produces a score between −0.5 and 0.5 for each variant at each position. Third, positions outside the 8-mer seed are inspected by dropping the least informative position within the seed and repeating the preceding analysis at every additional position that yields an 8-mer with at most three gaps (ensuring that the positions inspected outside of the 8-mer seed are based on a roughly equal number of samples to those within the 8-mer seed). This analysis produces the bar graph shown. Finally, these values are converted into a sequence logo by utilizing a suitably scaled Boltzmann distribution (see Supplementary Methods). (b) Logos for four additional TFs constructed using this method. For each, the organism and structural class are given. Consensus sequences in panels (a) and (b) were obtained from the literature for Cbf1 (ref. 27), Zif268 (ref. 28), Ceh-22 (ref. 29), Oct-1 (ref. 30), and Rap1 (ref. 12) (standard IUPAC abbreviations are used (K={T,G}; R={A,G}; Y={C,T}; N={A,C,G,T}). (c) Extension of the method for motif construction described in panel (a) to the case of di-nucleotide variants and applied to the first two positions in the Cbf1 motif. Here, all 16 variants of the form NNCACGTG were obtained and the enrichment score of each was computed.

References

    1. Mukherjee S, et al. Rapid analysis of the DNA-binding specificities of transcription factors with DNA microarrays. Nat Genet. 2004;36:1331–1339. - PMC - PubMed
    1. Bulyk ML, Huang X, Choo Y, Church GM. Exploring the DNA-binding specificities of zinc fingers with DNA microarrays. Proc Natl Acad Sci U S A. 2001;98:7158–7163. - PMC - PubMed
    1. Berger MF, Bulyk ML. Protein Binding Microarrays (PBMs) for rapid, high-throughput characterization of the sequence specificities of DNA-binding proteins. Methods in Molecular Biology. 2006;338:245–260. - PMC - PubMed
    1. Golomb S. Shift Register Sequences. Aegean Park Press; Laguna Hills, CA: 1967.
    1. Kwan AH, Czolij R, Mackay JP, Crossley M. Pentaprobe: a comprehensive sequence for the one-step detection of DNA-binding activities. Nucleic Acids Res. 2003;31:e124. - PMC - PubMed

Publication types

MeSH terms

Substances