

Understanding the dynamics of Ebola epidemics
- PMID: 16999875
- PMCID: PMC2870608
- DOI: 10.1017/S0950268806007217
Understanding the dynamics of Ebola epidemics
Abstract
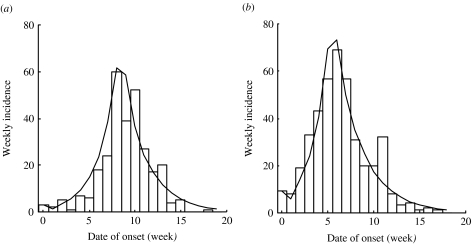
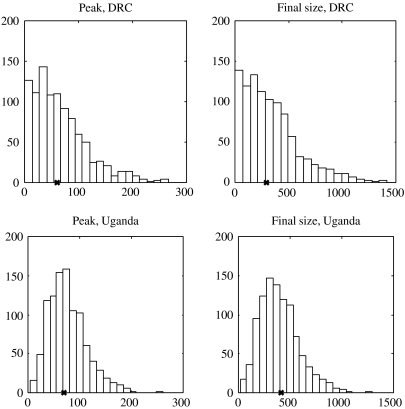
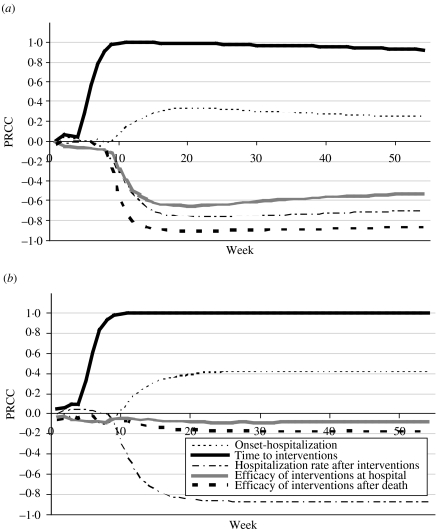
Ebola is a highly lethal virus, which has caused at least 14 confirmed outbreaks in Africa between 1976 and 2006. Using data from two epidemics [in Democratic Republic of Congo (DRC) in 1995 and in Uganda in 2000], we built a mathematical model for the spread of Ebola haemorrhagic fever epidemics taking into account transmission in different epidemiological settings. We estimated the basic reproduction number (R0) to be 2.7 (95% CI 1.9-2.8) for the 1995 epidemic in DRC, and 2.7 (95% CI 2.5-4.1) for the 2000 epidemic in Uganda. For each epidemic, we quantified transmission in different settings (illness in the community, hospitalization, and traditional burial) and simulated various epidemic scenarios to explore the impact of control interventions on a potential epidemic. A key parameter was the rapid institution of control measures. For both epidemic profiles identified, increasing hospitalization rate reduced the predicted epidemic size.
Figures
References
-
- Khan AS et al. The reemergence of Ebola hemorrhagic fever, Democratic Republic of the Congo, 1995. Commission de Lutte contre les Epidemies a Kikwit. Journal of Infectious Diseases. 1999;179:S76–S86. - PubMed
-
- Anon. Outbreak of Ebola haemorrhagic fever, Uganda, August 2000–January 2001. Weekly Epidemiological Record. 2001;76:41–46. - PubMed
-
- CDC. Outbreak of Ebola hemorrhagic fever Uganda, August 2000–January 2001. Morbidity and Mortality Weekly Report. 2001;50:73–77. - PubMed
Publication types
MeSH terms
LinkOut - more resources
Full Text Sources
Medical
