

Characterization of ATP-independent ERK inhibitors identified through in silico analysis of the active ERK2 structure
- PMID: 17000106
- PMCID: PMC1857279
- DOI: 10.1016/j.bmcl.2006.09.038
Characterization of ATP-independent ERK inhibitors identified through in silico analysis of the active ERK2 structure
Abstract
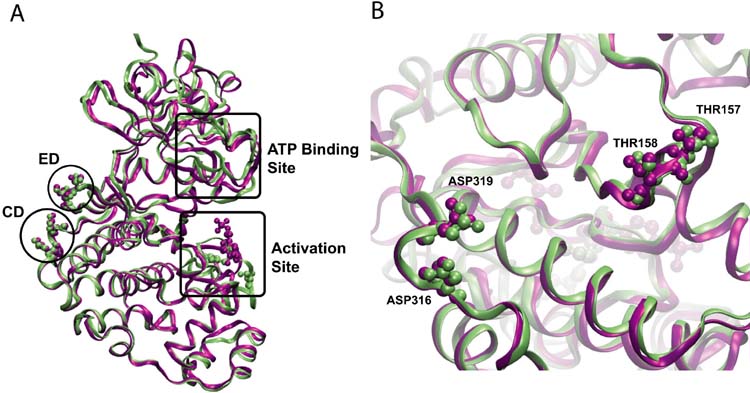
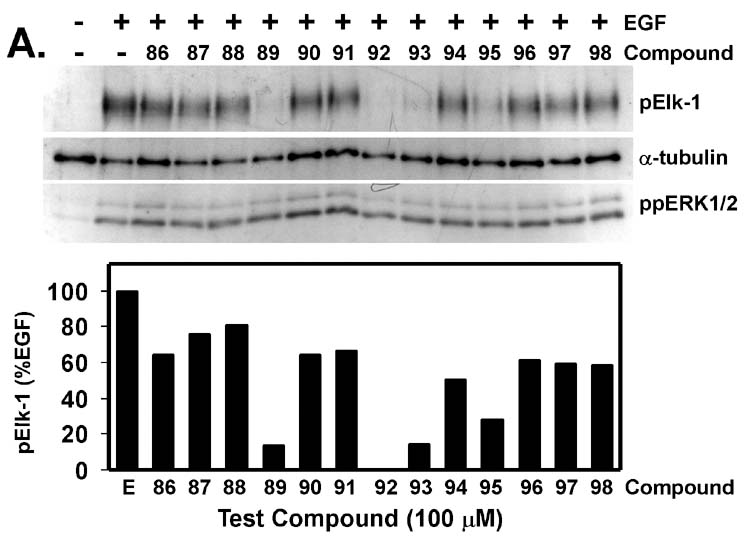
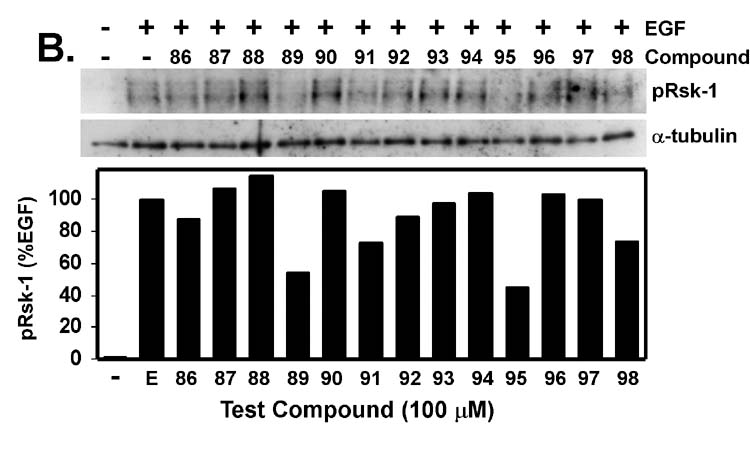
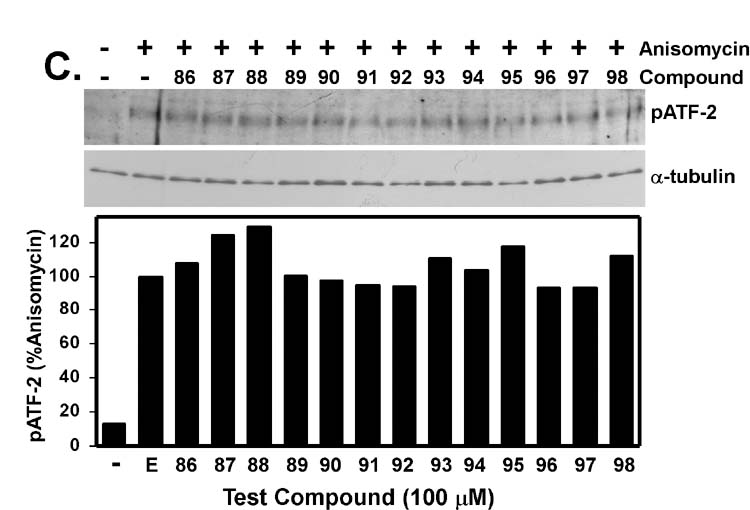
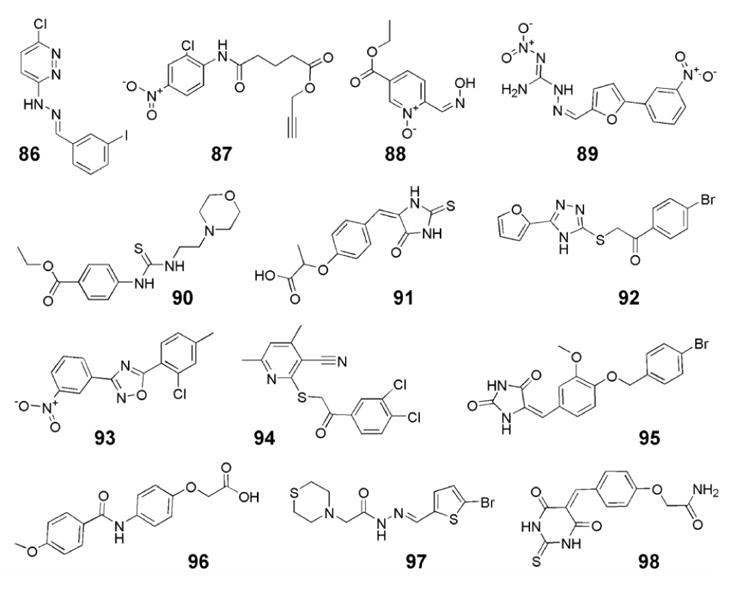
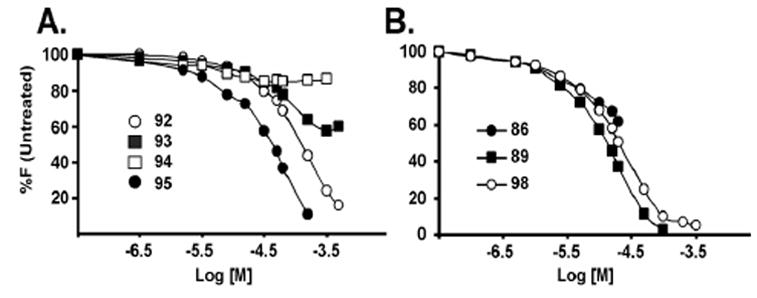
The extracellular signal-regulated kinases (ERK1 and ERK2) are important mediators of cell proliferation. Constitutive activation of the ERK proteins plays a critical role in the proliferation of many human cancers. Taking advantage of recently identified substrate docking domains on ERK2, we have used computer-aided drug design (CADD) to identify novel low molecular weight compounds that interact with ERK2 in an ATP-independent manner and disrupt substrate-specific interactions. In the current study, a CADD screen of the 3D structure of active phosphorylated ERK2 protein was used to identify inhibitory compounds. We tested 13 compounds identified by the CADD screen in ERK-specific phosphorylation, cell proliferation, and binding assays. Of the 13 compounds tested, 4 compounds strongly inhibited ERK-mediated phosphorylation of ribosomal S6 kinase-1 (Rsk-1) and/or the transcription factor Elk-1 and inhibited the proliferation of HeLa cervical carcinoma cells with IC(50) values in the 2-10 microM range. These studies demonstrate that CADD can be used to identify lead compounds for development of novel non-ATP-dependent inhibitors selective for active ERK and its interactions with substrates involved in cancer cell proliferation.
Figures
Similar articles
-
Identification of novel extracellular signal-regulated kinase docking domain inhibitors.J Med Chem. 2005 Jul 14;48(14):4586-95. doi: 10.1021/jm0501174. J Med Chem. 2005. PMID: 15999996
-
Slow inhibition and conformation selective properties of extracellular signal-regulated kinase 1 and 2 inhibitors.Biochemistry. 2015 Jan 13;54(1):22-31. doi: 10.1021/bi501101v. Epub 2014 Dec 4. Biochemistry. 2015. PMID: 25350931 Free PMC article.
-
Characterization of ERK docking domain inhibitors that induce apoptosis by targeting Rsk-1 and caspase-9.BMC Cancer. 2011 Jan 10;11:7. doi: 10.1186/1471-2407-11-7. BMC Cancer. 2011. PMID: 21219631 Free PMC article.
-
ERK1/2 MAP kinases: structure, function, and regulation.Pharmacol Res. 2012 Aug;66(2):105-43. doi: 10.1016/j.phrs.2012.04.005. Epub 2012 Apr 27. Pharmacol Res. 2012. PMID: 22569528 Review.
-
Development of extracellular signal-regulated kinase inhibitors.Curr Top Med Chem. 2009;9(8):678-89. doi: 10.2174/156802609789044416. Curr Top Med Chem. 2009. PMID: 19689374 Free PMC article. Review.
Cited by
-
Structural modifications of (Z)-3-(2-aminoethyl)-5-(4-ethoxybenzylidene)thiazolidine-2,4-dione that improve selectivity for inhibiting the proliferation of melanoma cells containing active ERK signaling.Org Biomol Chem. 2013 Jun 14;11(22):3706-32. doi: 10.1039/c3ob40199e. Org Biomol Chem. 2013. PMID: 23624850 Free PMC article.
-
Epoxyeicosatrienoic acids (EETs) regulate epithelial sodium channel activity by extracellular signal-regulated kinase 1/2 (ERK1/2)-mediated phosphorylation.J Biol Chem. 2013 Feb 15;288(7):5223-31. doi: 10.1074/jbc.M112.407981. Epub 2013 Jan 2. J Biol Chem. 2013. PMID: 23283969 Free PMC article.
-
Design, Synthesis and Biological Activity Evaluation of S-Substituted 1H-5-Mercapto-1,2,4-Triazole Derivatives as Antiproliferative Agents in Colorectal Cancer.Front Chem. 2018 Aug 23;6:373. doi: 10.3389/fchem.2018.00373. eCollection 2018. Front Chem. 2018. PMID: 30234098 Free PMC article.
-
Modulating multi-functional ERK complexes by covalent targeting of a recruitment site in vivo.Nat Commun. 2019 Nov 19;10(1):5232. doi: 10.1038/s41467-019-12996-8. Nat Commun. 2019. PMID: 31745079 Free PMC article.
-
Targeting ERK beyond the boundaries of the kinase active site in melanoma.Mol Carcinog. 2019 Sep;58(9):1551-1570. doi: 10.1002/mc.23047. Epub 2019 Jun 12. Mol Carcinog. 2019. PMID: 31190430 Free PMC article. Review.
References
-
- Kyriakis JM, Avruch J. Bioessays. 1996;18(7):567. - PubMed
-
- Reuter CW, Morgan MA, Bergmann L. Blood. 2000;96(5):1655. - PubMed
-
- Duesbery NS, Webb CP, Vande Woude GF. Nat Med. 1999;5(7):736. - PubMed
-
- Shapiro P. Crit Rev Clin Lab Sci. 2002;39(4–5):285. - PubMed
-
- Pearson G, Robinson F, Beers Gibson T, Xu BE, Karandikar M, Berman K, Cobb MH. Endocr Rev. 2001;22(2):153. - PubMed
Publication types
MeSH terms
Substances
Grants and funding
LinkOut - more resources
Full Text Sources
Other Literature Sources
Chemical Information
Molecular Biology Databases
Miscellaneous
