

Reactive oxygen species modulate the differentiation of neurons in clonal cortical cultures
- PMID: 17000118
- PMCID: PMC1797198
- DOI: 10.1016/j.mcn.2006.08.005
Reactive oxygen species modulate the differentiation of neurons in clonal cortical cultures
Abstract
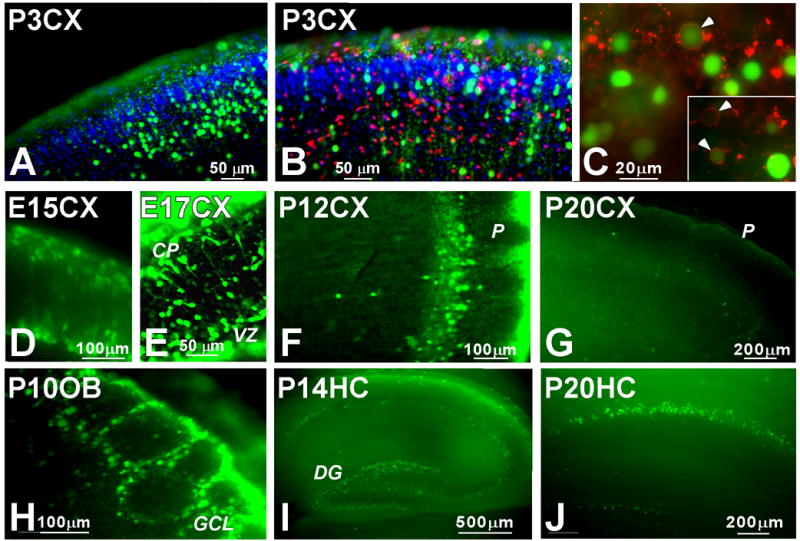
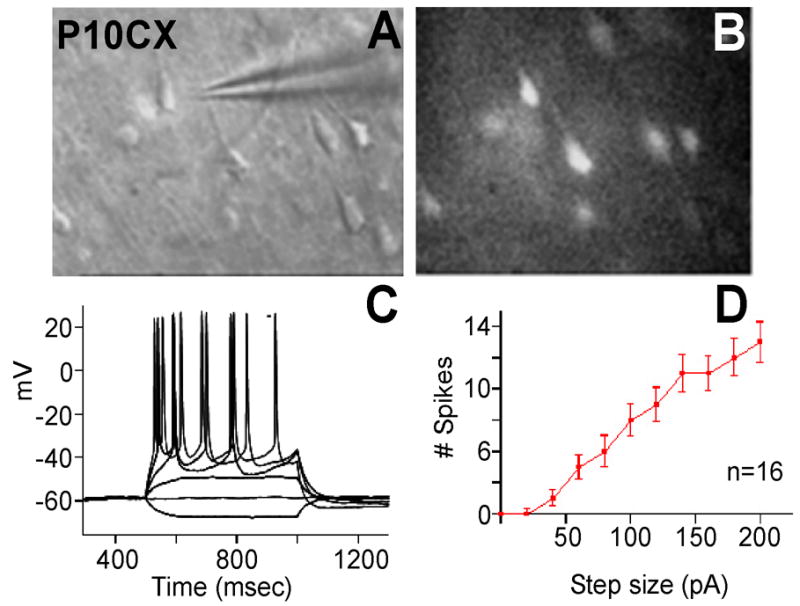
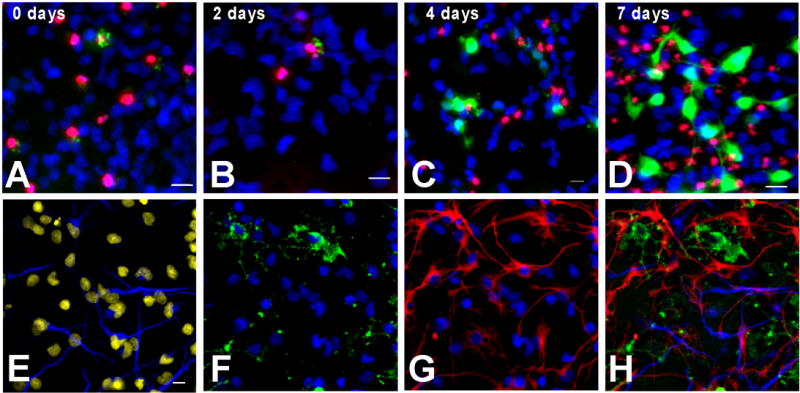
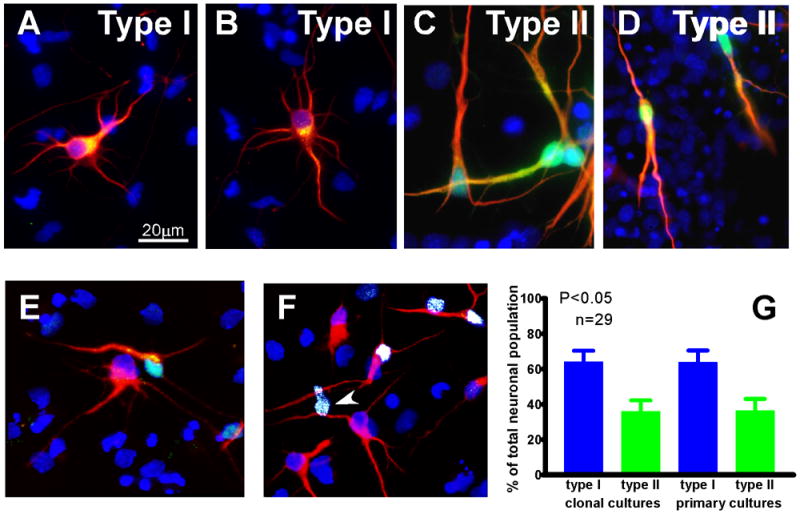
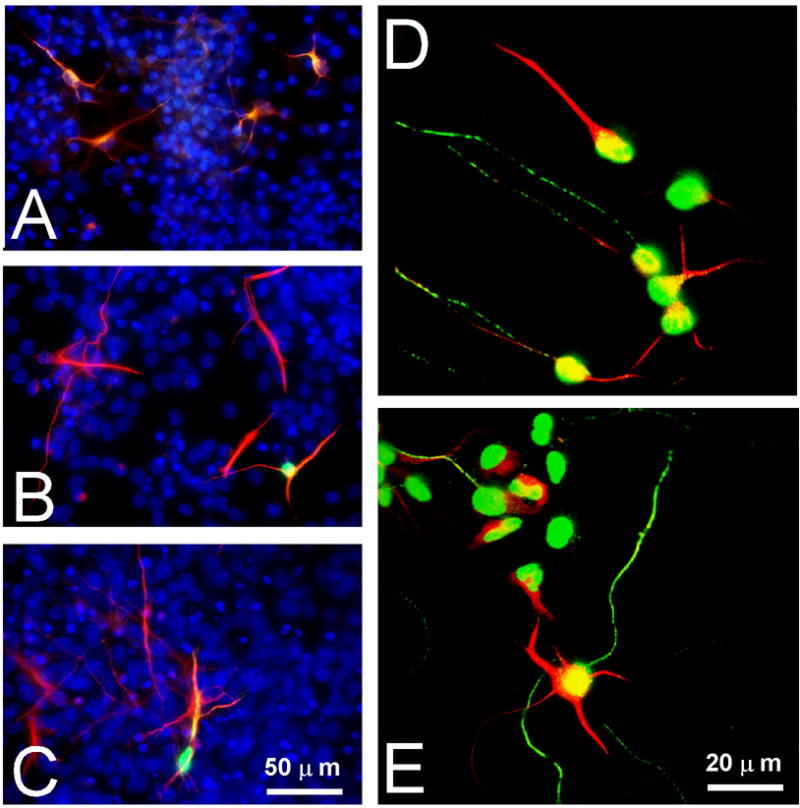
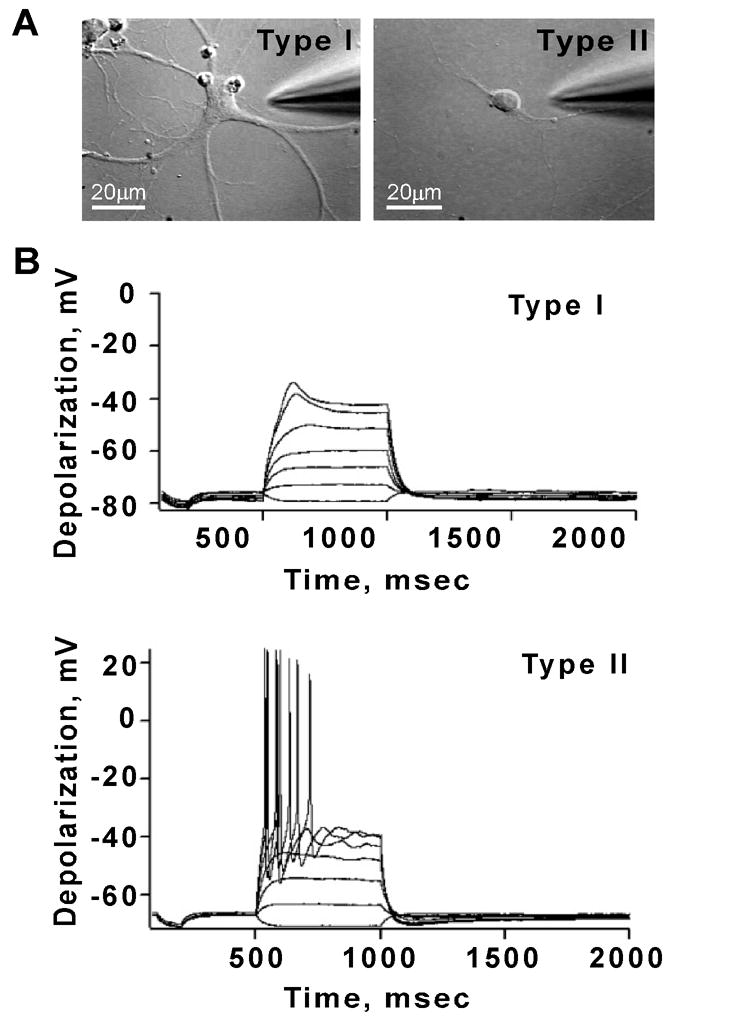
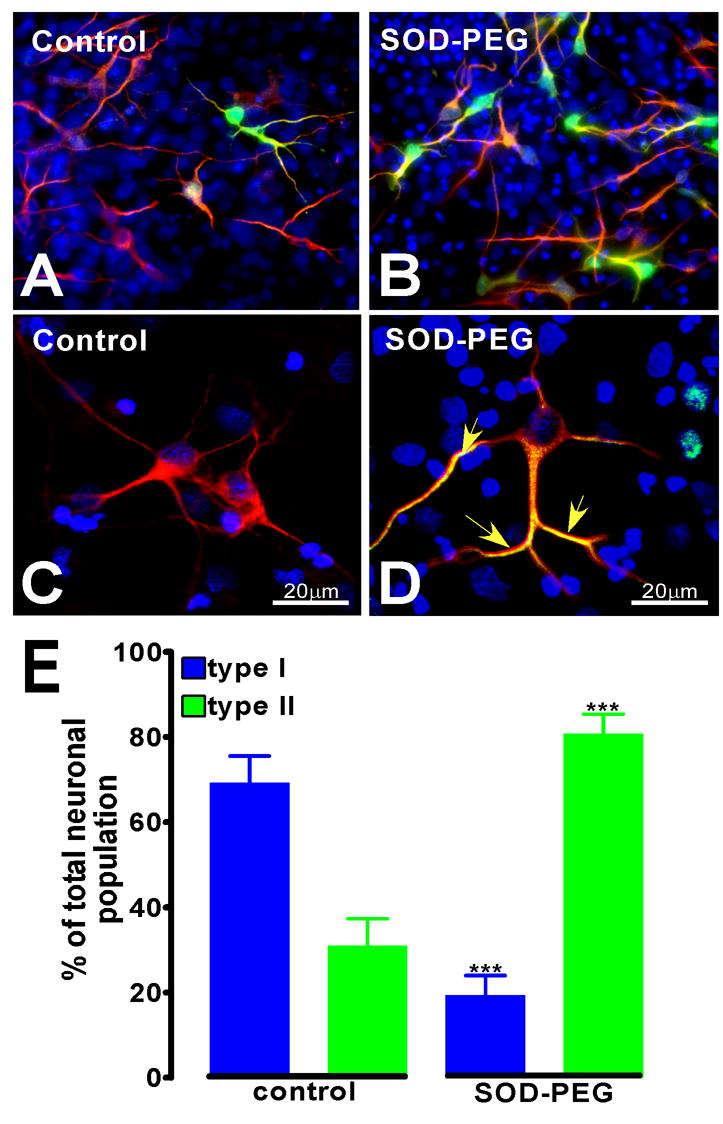
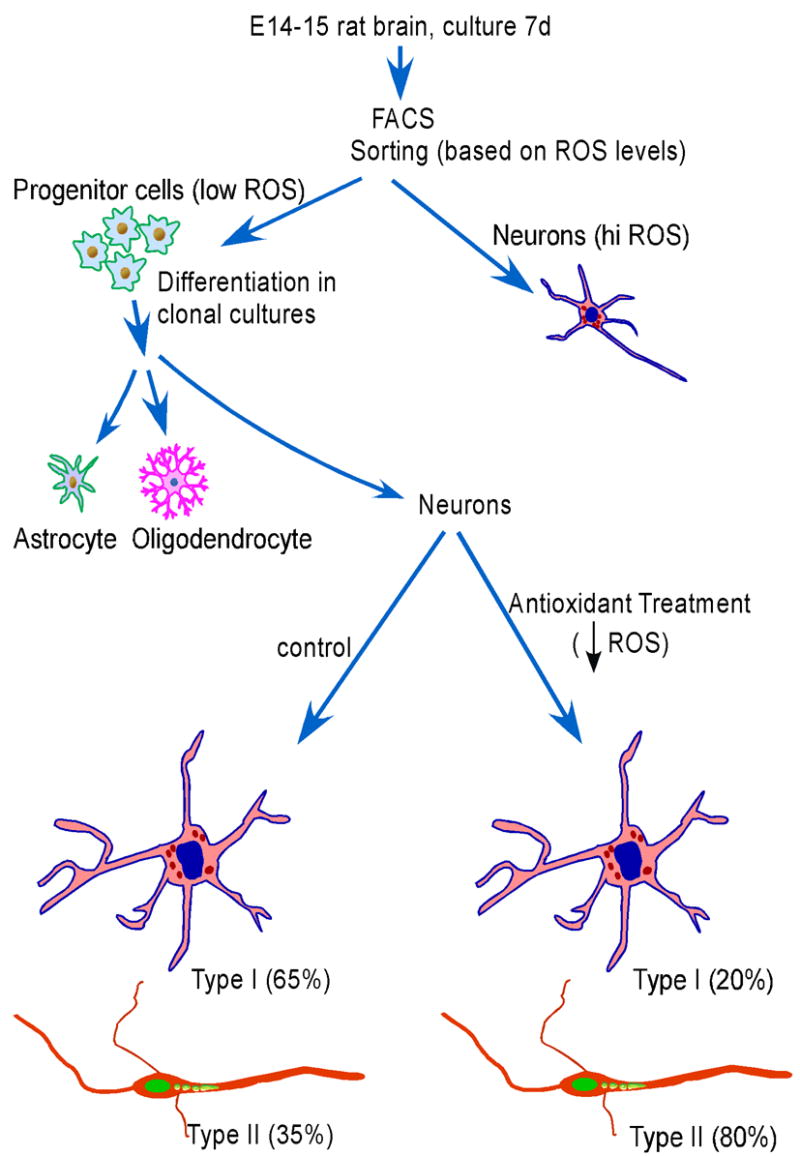
Reactive oxygen species (ROS) are important regulators of intracellular signaling. We examined the expression of ROS during rat brain development and explored their role in differentiation using cortical cultures. High levels of ROS were found in newborn neurons. Neurons produced ROS, not connected with cell death, throughout embryogenesis and postnatal stages. By P20, ROS-producing cells were found only in neurogenic regions. Cells with low levels of ROS, isolated from E15 brains by FACS, differentiated into neurons, oligodendrocytes, and astrocytes in clonal cultures. Neurons produced high ROS early in culture and later differentiated into two types: large pyramidal-like neurons that fired no or only a single action potential and smaller neurons that expressed nuclear calretinin and fired repeated action potentials. Antioxidant treatment did not alter neuron number but increased the ratio of small to large neurons. These findings suggest that modulation of ROS levels influences multiple aspects of neuronal differentiation.
Figures
Similar articles
-
Newborn neurons acquire high levels of reactive oxygen species and increased mitochondrial proteins upon differentiation from progenitors.Brain Res. 2005 Apr 8;1040(1-2):137-50. doi: 10.1016/j.brainres.2005.01.087. Brain Res. 2005. PMID: 15804435
-
Role of L-type Ca2+ channels in neural stem/progenitor cell differentiation.Eur J Neurosci. 2006 Feb;23(4):935-44. doi: 10.1111/j.1460-9568.2006.04628.x. Eur J Neurosci. 2006. PMID: 16519658
-
Functional and molecular development of striatal fast-spiking GABAergic interneurons and their cortical inputs.Eur J Neurosci. 2005 Sep;22(5):1097-108. doi: 10.1111/j.1460-9568.2005.04303.x. Eur J Neurosci. 2005. PMID: 16176351
-
Differential development of neuronal physiological responsiveness in two human neural stem cell lines.BMC Neurosci. 2007 May 25;8:36. doi: 10.1186/1471-2202-8-36. BMC Neurosci. 2007. PMID: 17531091 Free PMC article.
-
Cadmium induces reactive oxygen species generation and lipid peroxidation in cortical neurons in culture.Free Radic Biol Med. 2006 Mar 15;40(6):940-51. doi: 10.1016/j.freeradbiomed.2005.10.062. Epub 2005 Nov 21. Free Radic Biol Med. 2006. PMID: 16540389 Review.
Cited by
-
Reactive Oxygen Species: Angels and Demons in the Life of a Neuron.NeuroSci. 2022 Mar 16;3(1):130-145. doi: 10.3390/neurosci3010011. eCollection 2022 Mar. NeuroSci. 2022. PMID: 39484669 Free PMC article. Review.
-
Two faces of the coin: Minireview for dissecting the role of reactive oxygen species in stem cell potency and lineage commitment.J Adv Res. 2018 Jun 1;14:73-79. doi: 10.1016/j.jare.2018.05.012. eCollection 2018 Nov. J Adv Res. 2018. PMID: 30023134 Free PMC article. Review.
-
Utility of Reactive Species Generation in Plasma Medicine for Neuronal Development.Biomedicines. 2020 Sep 12;8(9):348. doi: 10.3390/biomedicines8090348. Biomedicines. 2020. PMID: 32932745 Free PMC article. Review.
-
ROS produced by NOX2 control in vitro development of cerebellar granule neurons development.ASN Neuro. 2015 Apr 13;7(2):1759091415578712. doi: 10.1177/1759091415578712. Print 2015 Mar-Apr. ASN Neuro. 2015. PMID: 25873309 Free PMC article.
-
Protective effects of butein on corticosterone-induced cytotoxicity in Neuro2A cells.IBRO Rep. 2020 Mar 3;8:82-90. doi: 10.1016/j.ibror.2020.02.002. eCollection 2020 Jun. IBRO Rep. 2020. PMID: 32181410 Free PMC article.
References
-
- Aguirre J, Rios-Momberg M, Hewitt D, Hansberg W. Reactive oxygen species and development in microbial eukaryotes. Trends Microbiol. 2005;13:111–118. - PubMed
-
- Babior BM. The leukocyte NADPH oxidase. Isr Med Assoc J. 2002;4:1023–1024. - PubMed
-
- Bayer SA, Altman J. Neurogenesis and Neuronal Migration. In: Paxinos G, editor. The Rat Nervous System. Academic Press; Sydney, Australia: 1995. pp. 1041–1078.
-
- Beckman JS, Minor RL, Jr, White CW, Repine JE, Rosen GM, Freeman BA. Superoxide dismutase and catalase conjugated to polyethylene glycol increases endothelial enzyme activity and oxidant resistance. J Biol Chem. 1988;263:6884–6892. - PubMed
Publication types
MeSH terms
Substances
Grants and funding
LinkOut - more resources
Full Text Sources
