

A new statistical method for estimating the usual intake of episodically consumed foods with application to their distribution
- PMID: 17000190
- PMCID: PMC2517157
- DOI: 10.1016/j.jada.2006.07.003
A new statistical method for estimating the usual intake of episodically consumed foods with application to their distribution
Abstract
Objective: We propose a new statistical method that uses information from two 24-hour recalls to estimate usual intake of episodically consumed foods.
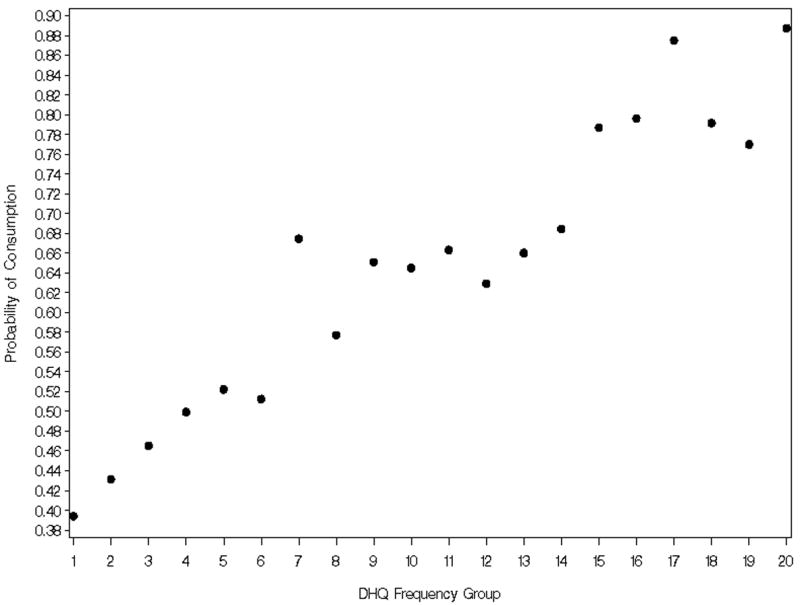
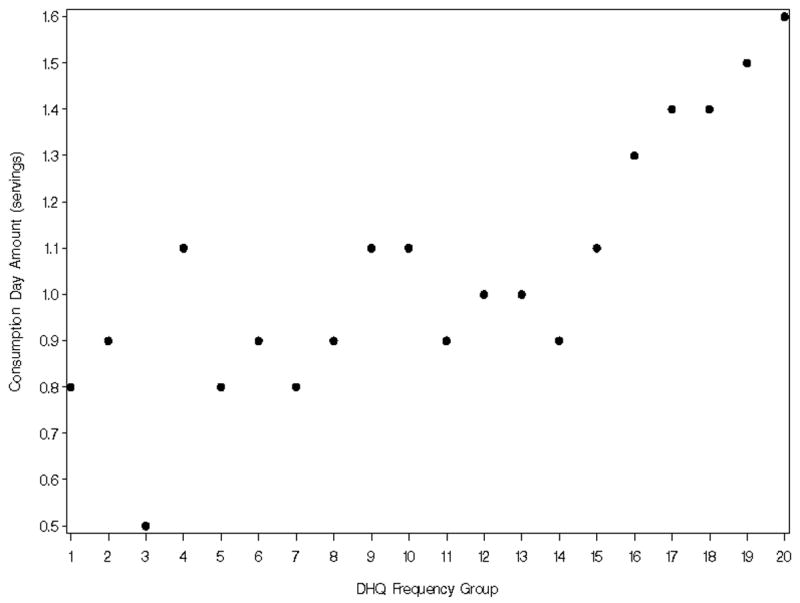
Statistical analyses performed: The method developed at the National Cancer Institute (NCI) accommodates the large number of nonconsumption days that occur with foods by separating the probability of consumption from the consumption-day amount, using a two-part model. Covariates, such as sex, age, race, or information from a food frequency questionnaire, may supplement the information from two or more 24-hour recalls using correlated mixed model regression. The model allows for correlation between the probability of consuming a food on a single day and the consumption-day amount. Percentiles of the distribution of usual intake are computed from the estimated model parameters.
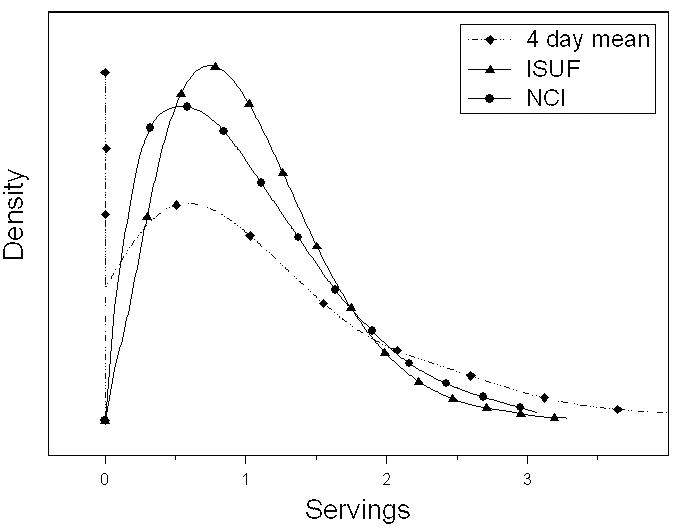
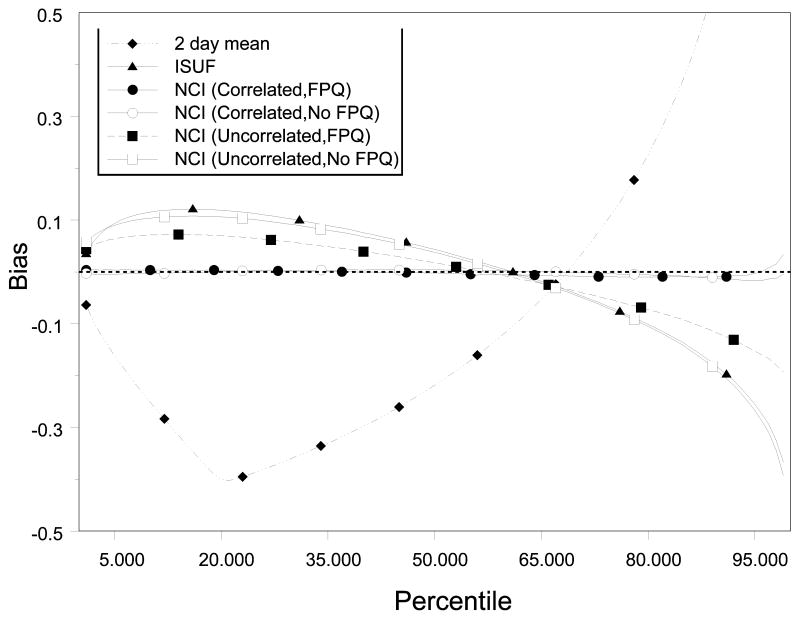
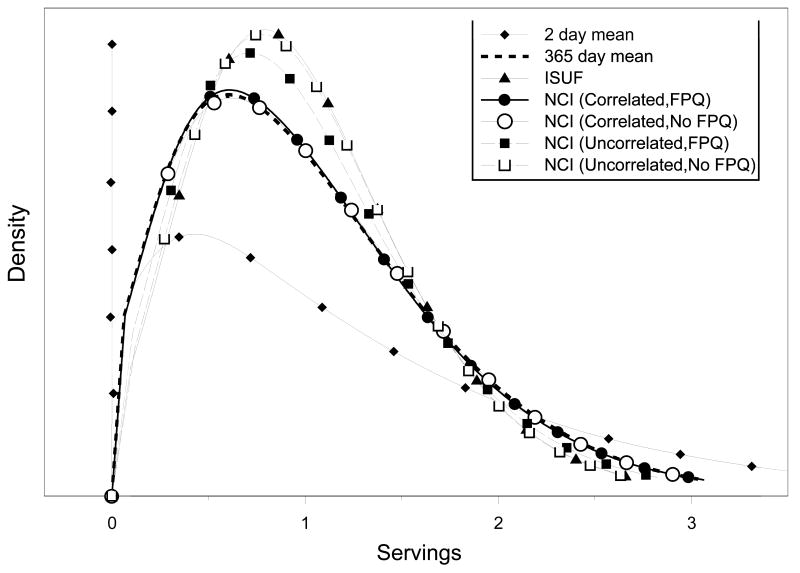
Results: The Eating at America's Table Study data are used to illustrate the method to estimate the distribution of usual intake for whole grains and dark-green vegetables for men and women and the distribution of usual intakes of whole grains by educational level among men. A simulation study indicates that the NCI method leads to substantial improvement over existing methods for estimating the distribution of usual intake of foods.
Conclusions: The NCI method provides distinct advantages over previously proposed methods by accounting for the correlation between probability of consumption and amount consumed and by incorporating covariate information. Researchers interested in estimating the distribution of usual intakes of foods for a population or subpopulation are advised to work with a statistician and incorporate the NCI method in analyses.
Figures
Comment in
-
Assessing dietary intake: new ideas and better approaches.J Am Diet Assoc. 2006 Oct;106(10):1533. doi: 10.1016/j.jada.2006.07.018. J Am Diet Assoc. 2006. PMID: 17000182 No abstract available.
References
-
- Dodd K, Guenther PM, Freedman LS, Subar AF, Kipnis V, Midthune D, Tooze JA, Krebs-Smith SM. Statistical methods for estimating usual intake of nutrients and foods: A review of the theory. under review. - PubMed
-
- Nusser SM, Fuller WA, Guenther PM. Estimation of usual dietary intake distributions: adjusting for measurement error and nonnormality in 24-hour food intake data. In: Trewin D, editor. Survey Measurement and Process Quality. New York, NY: Wiley; 1996. pp. 689–709.
-
- Tooze JA, Grunwald GK, Jones RH. Analysis of repeated measures data with clumping at zero. Stat Methods Med Res. 2002;11(4):341–355. - PubMed
-
- Box GEP, Cox DR. An analysis of transformations. J R Stat Soc Ser B. 1964;26:211–252.
-
- Subar AF, Dodd K, Guenther PM, Kipnis V, Midthune D, McDowell M, Tooze JA, Freedman LS, Krebs-Smith SM. The Food Propensity Questionnaire (FPQ): concept and development. Journal of the American Dietetic Association. in press. - PubMed
Publication types
MeSH terms
Grants and funding
LinkOut - more resources
Full Text Sources
Medical
