. 2006;34(18):e123.
doi: 10.1093/nar/gkl639. Epub 2006 Sep 25.

Nanoliter high throughput quantitative PCR

Affiliations

Nanoliter high throughput quantitative PCR

Tom Morrison et al. Nucleic Acids Res. 2006.

Abstract

Understanding biological complexity arising from patterns of gene expression requires accurate and precise measurement of RNA levels across large numbers of genes simultaneously. Real time PCR (RT-PCR) in a microtiter plate is the preferred method for quantitative transcriptional analysis but scaling RT-PCR to higher throughputs in this fluidic format is intrinsically limited by cost and logistic considerations. Hybridization microarrays measure the transcription of many thousands of genes simultaneously yet are limited by low sensitivity, dynamic range, accuracy and sample throughput. The hybrid approach described here combines the superior accuracy, precision and dynamic range of RT-PCR with the parallelism of a microarray in an array of 3072 real time, 33 nl polymerase chain reactions (RT-PCRs) the size of a microscope slide. RT-PCR is demonstrated with an accuracy and precision equivalent to the same assay in a 384-well microplate but in a 64-fold smaller reaction volume, a 24-fold higher analytical throughput and a workflow compatible with standard microplate protocols.


Figures

Figure 1
Figure 1
A stainless steel platen (317 stainless steel) the size of a microscope slide (25 mm × 75 mm × 0.3 mm) is photolithographically patterned and wet etched to form a rectilinear array of 3072 micro-machined, 320 μm diameter holes of 33 nl each. The 48 groups of 64 holes are spaced at 4.5 mm to match the pitch of the wells in a 384-well microplate. A PCR compatible PEG hydrophilic layer is amine-coupled to the interior surface of each hole and a hydrophobic fluoroalkyl layer is vinyl-coupled to the exterior surface of the platen, resulting in the retention in individual, isolated containers of PCR reagents and sample introduced onto the array.
Figure 2
Figure 2
Three through-hole arrays were loaded with PCR reagents containing 500 starting templates per hole and subjected to 32 cycles of PCR. The amplicon product image (A) was generated by pixel-by-pixel subtraction of cycle image 1 from 19 for Array 1. The CT color map for Array 1 (B) indicates holes within CT 1 STD from average (white), CT < average −1 STD (blue), CT > average +1 STD (red) and failed reactions (yellow). CT distribution plot (C) for all three arrays, and performance specifications table (D) for each array analyzed either independently or combined, summarize the instrumentation uniformity results.
Figure 3
Figure 3
Following 32 cycles of PCR, the arrays in Figure 2 were cooled to 65°C then slowly heated to 92°C at 1 C/min. A dissociation curve (F versus T) and Tm [(−dF/dT)max] was calculated for each sample from fluorescent images collected every 0.25C. The heat map (A) for Array 1 indicates Tm spanning 79.5°C (yellow) to 81.3°C (light blue). Plot (B) indicates the Tm distribution for all three arrays and Table (C) breaks down the Tm performance either independently or combined.
Figure 4
Figure 4
qPCR Titration Curve. (A) depicts cycle-by-cycle log SYBR fluorescence of each through hole colored according to average starting amplicon copy per hole [107 to 1 plus no template control (gray), 12 of the 64 replicates depicted]. (B) indicates average CT (open circles) and STD CT (filled circles) plotted against log starting copies (n = 64); line formula and Pearsons Coefficient were calculated from dashed CT curve. Predicted Poisson noise is indicated by the solid curve.
Figure 5
Figure 5
Human heart and liver differential kinase gene expression. A Gene Ontology database was used to select 507 human kinase genes along with 13 housekeeping genes. Primers were designed, loaded into a through-hole array and SYBR Green PCR was used to measure transcript levels of normal human liver (B) or heart (A) samples. Replicate 1 samples were at 1 ng/hole, whereas replicate 2 samples were at either 1 ng/hole (filled circles) or 0.25 ng/hole (open circles). The solid diagonal lines represent 1:1 correlation for 1 ng cDNA/through-hole, and the dashed line the 1:1 correlation for 0.25 ng cDNA/through-hole. The cumulative distribution of assay standard deviation at 1 ng/hole for both liver and heart samples (C) shows over 70% of the assays have a precision <0.5. ΔCT for the difference in sample assay pair (Replicate 2–Replicate 1) is represented in histogram (D), liver indicated by unfilled bars and heart indicated by filled bars.
Figure 6
Figure 6
Liver and heart kinase genes differential expression. CT data from both tissues at 1 ng/hole was normalized relative to the geometric mean of six housekeeping genes; B2M (NM_004048), ACTB (NM_001101), EEF1A1 (NM_001402), HMBS (NM_000190), TBP (NM_003194), PPIA (NM_021130) and plotted as (ΔCT)Heart versus (ΔCT)Liver in (A). Open circles are DCT measurements (n = 3 replicates) and solid circles are housekeeping genes normalizing dataset (n = 4 replicates). Error lines (dashed lines) are STD compared with linear fit to housekeeping genes (solid line, R2 = 0.99). Genes with tissue-specific expression (CT 20 in one tissue, CT < 20 in the other tissue) are indicated by crosses. Expression of individual genes are indicated as follows: GCK (filled diamond), PGK1 (filled square), PGK2 (open square), PKLR (filled triangle), PKM2 (open triangle), PFKL (filled circle) and PFKM (open circle). Concordance data (B) for 21 transcript assays selected from 7 kinase genes spanning a 4000-fold differential heart and liver expression, along with 12 housekeeping genes, were used to perform microplate qPCR in an ABI 7900 at 3 replicates per sample. Average ΔΔCT were calculated and compared with the same assays in the PCR array; STD (error bars), and 1:1 correlation (dashed line).
Figure 7
Figure 7
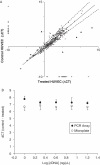
Transcript analysis of TNF-α treated HUVEC. PCR arrays were used to make transcript measurements of cDNA generated from pooled HUVEC cells treated with either TNF-α or vehicle. Samples were normalized (ΔCT) by subtracting the geometric mean of 13 housekeeping genes from the CT of each assay. (A) Correlates ΔCT between treated and untreated assays (circles), triangles showing significant difference were, from left-to-right genes CCL2 (NM_002982), SELE (NM_000450), TNFAIP2 (NM_006291), TNFAIP3 (NM_006290), VCAM1 (P < 0.001, n ≥ 2 technical replicates) and targets detected in one sample but not the other (pluses). (B) Examines fold difference in expression in SELE between treated and control HUVEC measured in PCR array and microplate at differing cDNA input quantity (error bars are STD, n ≥ 3).

References

    1. Pease A.C., Solas D., Sullivan E.J., Cronin M.T., Holmes C.P., Fodor S.P. Light generated oligonuleotide arrays for rapid DNA sequence analysis. Proc. Natl Acad. Sci. USA. 1994;11:5022–5026. - PMC - PubMed
    1. Lipshutz R.J., Morris D., Chee M., Hubbell E., Kozal M.J., Shah N., Shen N., Yang R., Fodor S.P. Using oligonucleotide probe arrays to access genetic diversity. Biotechniques. 1995;19:442–447. - PubMed
    1. Schena M., Shalon D., Davis R.W., Brown P.O. Quantitative monitoring of gene expression patterns with a complementary DNA microarray. Science. 1995;5235:368–369. - PubMed
    1. Gershon D. Micorarray technology: an array of opportunites. Nature. 2002;416:885–891. - PubMed
    1. Murphy D. Gene expression studies using microarrays: principles, problems and prospects. Adv. Physiol. Educ. 2002;26:256–270. - PubMed

Publication types

MeSH terms