. 2006;34(18):e121.
doi: 10.1093/nar/gkl478. Epub 2006 Sep 25.

Capturing genomic signatures of DNA sequence variation using a standard anonymous microarray platform

Affiliations

Capturing genomic signatures of DNA sequence variation using a standard anonymous microarray platform

C H Cannon et al. Nucleic Acids Res. 2006.

Abstract

Comparative genomics, using the model organism approach, has provided powerful insights into the structure and evolution of whole genomes. Unfortunately, only a small fraction of Earth's biodiversity will have its genome sequenced in the foreseeable future. Most wild organisms have radically different life histories and evolutionary genomics than current model systems. A novel technique is needed to expand comparative genomics to a wider range of organisms. Here, we describe a novel approach using an anonymous DNA microarray platform that gathers genomic samples of sequence variation from any organism. Oligonucleotide probe sequences placed on a custom 44 K array were 25 bp long and designed using a simple set of criteria to maximize their complexity and dispersion in sequence probability space. Using whole genomic samples from three known genomes (mouse, rat and human) and one unknown (Gonystylus bancanus), we demonstrate and validate its power, reliability, transitivity and sensitivity. Using two separate statistical analyses, a large numbers of genomic 'indicator' probes were discovered. The construction of a genomic signature database based upon this technique would allow virtual comparisons and simple queries could generate optimal subsets of markers to be used in large-scale assays, using simple downstream techniques. Biologists from a wide range of fields, studying almost any organism, could efficiently perform genomic comparisons, at potentially any phylogenetic level after performing a small number of standardized DNA microarray hybridizations. Possibilities for refining and expanding the approach are discussed.


Figures

Figure 1
Figure 1
Affinity of four genomes to the SHyP array. (A) Experimental design for genomic comparisons. Each arrow indicates a direct hybridization experiment in which the indicated genome was labeled with Cy3 and compared to the other genome, labeled with Cy5. The rat genome was used in a self-self hybridization. Color-coding of genomes is consistent (B-E,G). Log[Average] hybridization intensity across for each genomic comparison: (B) mouse-rat; (C) mouse-human; (D) rat-human; (E) rat–rat and (G) raminSk5-raminSu5. Only ‘indicator’ probes for at least one genome are shown, including ‘rodent’ as purple (see Materials and Methods). (F) The results from the direct comparison among the three known genomes are shown in the overlapping circles. The central number indicates the probes with apparent hybridization to all four genomes. The number of probes unique to each genome are shown in the outer arcs. The interstices illustrate the number of probes common to both genomes. The small white circle in the rat circle represents the false positives observed in the rat–rat hybridization. (H) The ‘population-indicator’ are color-coded for the ramin species, while non-significant probes are shown in gray.
Figure 2
Figure 2
Affinity of four genomes with low variance SHyP probes. Genomes are color-coded as in Figure 1: mouse (red), rat (blue), human (green) and ramin (orange). Each color-coded column represents a specific class of indicator probes: all genomes (white, n = 224), mammal (light gray, n = 682), rodent (dark gray, n = 729), mouse (pink, n = 644), rat (light blue, n = 491), human (light green, n = 233) and ramin (light orange, n = 76). Each class of indicator probes are ordered from low to high average Log[intensity] across all genomes. The solid line indicates the cut-off for presence/absence of signal, as determined by our statistical analysis. Obviously homoplasious probes are indicated in the white space between the rat and human graphs. Homoplasious probes found in both human and ramin are beige.
Figure 3
Figure 3
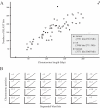
The distribution of some SHyP probes in known genomes. (A) The relationship between chromosome length and the number of BLAST hits observed using 3190 probes sequences, all with strong hybridization intensities. Each point represents a single chromosome and the number of hits with ≥18 complementary base pairs are shown. (B) Human chromosome maps showing the accumulation of probes from end to end for each chromosome. Vertical breaks indicate an absence of probes in that segment while horizontal lines illustrate probe-rich regions.

References

    1. Frazer K.A., Elnitski L., Church D.M., Dubchak I., Hardison R.C. Cross-species sequence comparisons: a review of methods and available resources. Genome Res. 2003;13:1–12. - PMC - PubMed
    1. Miller W., Makova K.D., Nekrutenko A., Hardison R.C. Comparative genomics. Annu. Rev. Genomics Hum. Genet. 2004;5:15–56. - PubMed
    1. NCBI. Genomic biology. National Center for Biotechnology Information. 2006 http://www.ncbi.nih.gov/Genomes
    1. Metzker M.L. Emerging technologies in DNA sequencing. Genome Res. 2005;15:1767–1776. - PubMed
    1. Shendure J., Mitra R.D., Varma C., Church G.M. Advanced sequencing technologies: methods and goals. Nature Rev. Genet. 2004;5:335–344. - PubMed

Publication types

Substances