. 2006 Dec;26(24):9291-301.
doi: 10.1128/MCB.01183-06. Epub 2006 Sep 25.

Evolutionarily conserved role of nucleostemin: controlling proliferation of stem/progenitor cells during early vertebrate development

Affiliations

Evolutionarily conserved role of nucleostemin: controlling proliferation of stem/progenitor cells during early vertebrate development

Chantal Beekman et al. Mol Cell Biol. 2006 Dec.

Abstract

Nucleostemin (NS) is a putative GTPase expressed preferentially in the nucleoli of neuronal and embryonic stem cells and several cancer cell lines. Transfection and knockdown studies indicated that NS controls the proliferation of these cells by interacting with the p53 tumor suppressor protein and regulating its activity. To assess the physiological role of NS in vivo, we generated a mutant mouse line with a specific gene trap event that inactivates the NS allele. The corresponding NS(-/-) embryos died around embryonic day 4. Analyses of NS mutant blastocysts indicated that NS is not required to maintain pluripotency, nucleolar integrity, or survival of the embryonic stem cells. However, the homozygous mutant blastocysts failed to enter S phase even in the absence of functional p53. Haploid insufficiency of NS in mouse embryonic fibroblasts leads to decreased cell proliferation. NS also functions in early amphibian development to control cell proliferation of neural progenitor cells. Our results show that NS has a unique ability, derived from an ancestral function, to control the proliferation rate of stem/progenitor cells in vivo independently of p53.


Figures

FIG. 1.
FIG. 1.
A gene trap event into the NS locus leads to a null NS mutation and early embryonic lethality in mice. (A) The structure of the retroviral construct along with the structures of the wild-type and mutated alleles and the positions of the oligonucleotides used for the PCR-based strategy are depicted. Exons are indicated by black boxes, and the long terminal repeats (LTR) of the viral vector are represented by light gray boxes. β-geo, lacZ/neomycin reporter/selection cassette. (B) PCR analysis of embryos with the indicated genotypes. The three primers, a, b, and c, are indicated. (C) Morphology of NS wild-type (+/+ or +/−) and homozygous mutant (−/−) E3.5 to E4.0 embryos. Magnification, ×200 (phase-contrast microscopy). (D) NS is expressed in the nucleoli of blastocysts. Blastocysts were recovered from NS+/ intercrosses, fixed, and stained with anti-NS antibody (red). Nuclei were visualized with DAPI staining (blue). About 25% of the embryos failed to stain for NS. Magnification, ×200.
FIG. 2.
FIG. 2.
Failure of the NS−/− blastocyst cells to proliferate normally. (A and B) number of nuclei detected by DAPI staining of blastocysts from NS+/− intercrosses. (A) Mean cell number of wild-type and heterozygous embryos combined and of homozygous NS embryos at E3.0 and E3.5. Error bars denote standard errors. There is a significant difference between the mean numbers by Student's t test at both stages of development (E3.0, P = 6.10−13; E3.5, P = 1.10−11). (B) Representative images of E3.5 NS+/+ or NS+/− and NS−/− mutant embryos stained with DAPI (blue) and anti-NS (red) antibodies. Magnification, ×200. (C and D) Number of cells positive for phospho-Ser-histone H3 (P-H3, the M-phase specific marker) among the total number of blastocyst cells (determined by DAPI staining of nuclear DNA). (C) The percentage of P-H3-positive cells in wild-type and heterozygous embryos combined and in homozygous NS embryos at E3.0. Error bars denote standard errors. There is a significant difference between the mean numbers by Student's t test (P = 0.03). (D) Representative images of E3.0 NS+/+ or NS+/− and NS−/− mutant embryos stained with DAPI (blue), anti-P-H3 antibody (green), and anti-NS antibody (red). Magnification, ×200. (E and F) NS-deficient blastocysts fail to incorporate BrdU. Blastocysts were collected and cultured for 16 h in ES cell medium containing 50 μM BrdU. (E) The percentage of BrdU-positive cells among the total number of blastocyst cells (determined by DAPI staining of nuclei) in wild-type and heterozygous embryos combined and in homozygous NS embryos at E4.0. Error bars denote standard errors. There is a significant difference between the mean numbers by Student's t test (P = 2.10−10). (D) Representative images of E4.0 NS+/+ or NS+/− and NS−/− mutant embryos stained with DAPI (blue), anti-BrdU antibody (green), and anti-NS antibody (red). Magnification, ×200. n, number of embryos analyzed.
FIG. 3.
FIG. 3.
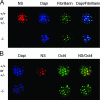
NS is not required for nucleolar integrity or to maintain pluripotency. (A) Representative images of E3.5 NS+/+ or NS+/− and NS−/− mutant embryos stained with DAPI (blue), antifibrillarin (green), and anti-NS (red) antibodies. Fibrillarin nucleolar localization is not perturbed in NS-deficient blastocysts. (B) Representative images of E3.5 NS+/+ or NS+/− and NS−/− mutant embryos stained with DAPI (blue), anti-Oct3/4 (green), and anti-NS (red) antibodies. NS-deficient blastocysts maintain expression of Oct4, the marker of pluripotent stem cells. Magnification, ×200.
FIG. 4.
FIG. 4.
p53 loss does not rescue NS deficiency; number of nuclei detected by DAPI staining of blastocysts from NS+/ p53−/− intercross matings. (A) Representative images of E3.5, p53-null, NS+/+ or NS+/− and NS−/− mutant embryos stained with DAPI (blue) and anti-NS antibody (red). (B) Mean cell number of wild-type and heterozygous embryos combined and of homozygous NS embryos on a p53-deficient background at E3.0. Error bars denote standard errors. There is a significant difference between the mean numbers by Student's t test (P = 0.06). n, number of embryos analyzed. Magnification, ×200.
FIG. 5.
FIG. 5.
Haploid insufficiency of NS in MEFs leads to reduced proliferative potential. (A) NS endogenous protein is detected by Western blotting analysis in total extracts from E10.5 embryos (top panel) or in MEFs at various passages (lower panel). A significant decrease in NS protein expression is detected in cells prepared from NS+/− heterozygous embryos, and NS expression decreases at late passages. γ-Tubulin (γ-tub) serves as a loading control here. (B) The NS protein (green) is mainly localized in the MEF nucleoli, as assessed by indirect immunofluorescence. Nuclei are visualized using DAPI staining. (C) Growth curves for NS+/− and NS−/− MEF cultures at passage 4. Cells (1 × 10⁵) were plated into six-well plates. Cultures were harvested at daily intervals, and the total number of cells was determined and normalized to the number of cells at day 1 (20 h after plating). The numbers refer to the mean values of four independently derived MEF cultures of each genotype. (D) Proliferation of NS+/− and NS−/− MEF cultures on a revisited 3T3 schedule. The accumulated number of population doublings is shown on a linear scale on the y axis.
FIG. 6.
FIG. 6.
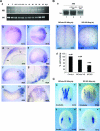
XNS is expressed during early embryogenesis in proliferating tissues and its depletion affects the pattern of cell division and the expression of neuronal and neural crest markers. (A, part a) Expression of XNS during embryogenesis analyzed by RT-PCR. Control RT-PCR of histone H4 was used as a loading control. Note that XNS is expressed both maternally and zygotically. (A, parts b to i) Whole-mount in situ hybridization of XNS expression at the indicated stages Nieuwkoop-Faber stages (St) (27). (A, parts b and c) Dorsal views, anterior right. (A, parts d and i) Transversal sections at the indicated levels of the embryo shown in parts c and h, respectively. (A, parts e, f, and h) Lateral views, anterior right. (A, part g) Horizontal section of the embryo in part f at the level indicated. Note that XNS expression is first detected at the neurula stage in ectodermal cells of the sensorial layer, particularly around the anterior neural plate. At the tailbud and tadpole stages, XNS staining is observed in migratory cranial neural crests, the eye, and the otic vesicle. (i) Within the neural tube, XNS expression is restricted to the ventricular zone. np, neural plate; nc, neural crest; sle, sensorial layer of the ectoderm; ev, eye vesicle; s, somites; ov, otic vesicle; ba branchial arches. (B, part a) The XNS MO inhibits translation of XNS in vitro, whereas the XNSmis MO does not. (B, part b) Injection of the XNS MO, but not XNSmis, decreases the number of mitotic cells, as revealed using an antibody recognizing phosphorylated histone H3 (α-pH 3). Dorsal view of XNS MO- and XNSmis MO-injected embryos are shown. LacZ was coinjected as a lineage tracer. Control and injected sides revealed by LacZ staining are indicated (bottom panel). (d) Quantification of the results (percentage of pH 3-positive cells compared to control embryos). There is a significant difference between the percentages in control and MO NS-injected embryos by chi-square test (P = 0.002). n, number of cases analyzed. (C, parts a and d) XNS MO, but not XNSmis MO, decreases the expression of the indicated neuronal and neural crest markers at the neurula stage. The injected side is revealed by LacZ staining.

References

    1. Artus, J., C. Babinet, and M. Cohen-Tannoudji. 2006. The cell cycle of early mammalian embryos: lessons from genetic mouse models. Cell Cycle 5:499-502. - PubMed
    1. Baserga, R., R. D. Estensen, and R. O. Petersen. 1965. Inhibition of DNA synthesis in Ehrlich ascites cells by actinomycin D. II. The presynthetic block in the cell cycle. Proc. Natl. Acad. Sci. USA 54:1141-1148. - PMC - PubMed
    1. Bassler J., P. Grandi, O. Gadal, T. Lessmann, E. Petfalski, D. Tollervey, J. Lechner, and E. Hurt. 2001. Identification of a 60S preribosomal particle that is closely linked to nuclear export. Mol. Cell 8:517-529. - PubMed
    1. Bellmeyer, A., J. Krase, J. Lindgren, and C. LaBonne. 2003. The protooncogene c-myc is an essential regulator of neural crest formation in xenopus. Dev. Cell 4:827-839. - PubMed
    1. Bernardi, R., and P. P. Pandolfi. 2003. The nucleolus: at the stem of immortality. Nat. Med. 9:24-25. - PubMed

Publication types

MeSH terms