. 2006 Dec;26(23):9003-15.
doi: 10.1128/MCB.01811-05. Epub 2006 Sep 25.

Normal establishment of epithelial tight junctions in mice and cultured cells lacking expression of ZO-3, a tight-junction MAGUK protein

Affiliations

Normal establishment of epithelial tight junctions in mice and cultured cells lacking expression of ZO-3, a tight-junction MAGUK protein

Makoto Adachi et al. Mol Cell Biol. 2006 Dec.

Abstract

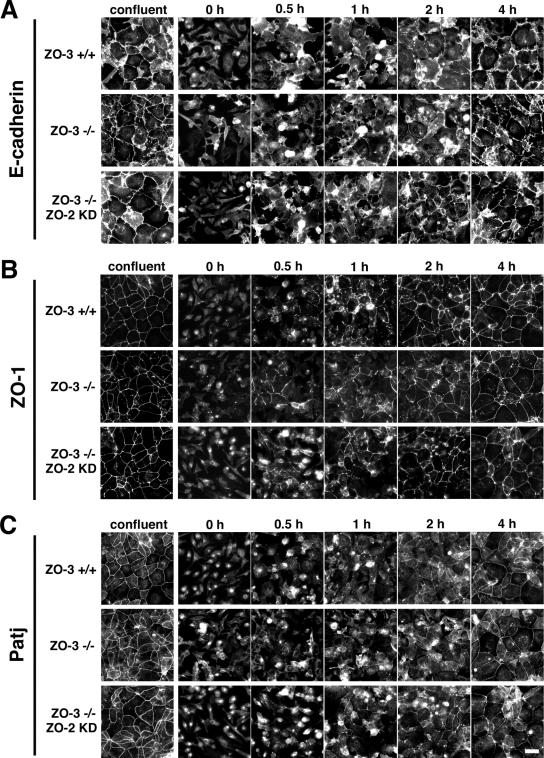
ZO-1, ZO-2, and ZO-3 are closely related MAGUK family proteins that localize at the cytoplasmic surface of tight junctions (TJs). ZO-1 and ZO-2 are expressed in both epithelia and endothelia, whereas ZO-3 is exclusively expressed in epithelia. In spite of intensive studies of these TJ MAGUKs, our knowledge of their functions in vivo, especially those of ZO-3, is still fragmentary. Here, we have generated mice, as well as F9 teratocarcinoma cell lines, that do not express ZO-3 by homologous recombination. Unexpectedly, ZO-3(-/-) mice were viable and fertile, and rigorous phenotypic analyses identified no significant abnormalities. Moreover, ZO-3-deficient F9 teratocarcinoma cells differentiated normally into visceral endoderm epithelium-like cells in the presence of retinoic acid. These cells had a normal epithelial appearance, and the molecular architecture of their TJs did not appear to be affected, except that TJ localization of ZO-2 was upregulated. Suppression of ZO-2 expression by RNA interference in ZO-3(-/-) cells, however, did not affect the architecture of TJs. Furthermore, the speed with which TJs formed after a Ca(2+) switch was indistinguishable between wild-type and ZO-3(-/-) cells. These findings indicate that ZO-3 is dispensable in vivo in terms of individual viability, epithelial differentiation, and the establishment of TJs, at least in the laboratory environment.


Figures

FIG. 1.
FIG. 1.
Schematic representation of ZO-1, ZO-2, and ZO-3. (A) Domain organization of three TJ MAGUKs. They have three PDZ domains, one SH3 domain, and one GUK domain in this order from their NH2 termini in common. (B) Amino acid sequence identities between the three MAGUKs. The values shown are percent identities between the full-length and the respective domains of these proteins. Although these proteins have significant structural similarity, the overall similarity between ZO-3 and ZO-1 and between ZO-3 and ZO-2 was slightly weaker than the similarity between ZO-1 and ZO-2. Identity values were calculated by using Genetyx Mac software.
FIG. 2.
FIG. 2.
Generation of ZO-3−/− mice. (A) Restriction maps of the wild-type allele, the targeting vector (targeting vector I), and the targeted allele of the mouse ZO-3 gene. The ZO-3 gene is composed of 21 exons, and the first ATG and the stop TGA codons are located in the putative exons 2 and 21, respectively. Targeting vector I contains the LacZ/PGK-Neo cassette in its middle portion to delete all exons that encompass the ORF of ZO-3, i.e., exon 2 to exon 21, in the targeted allele. The position of the 3′ probe for Southern blotting (3′probe-1) is indicated as bars. (B) Genotype analyses by Southern blotting of EcoRI-digested genomic DNA from wild-type (+/+), heterozygous (+/−), and homozygous (−/−) mice with respect to the mutant ZO-3 gene allele. Southern blotting with 3′probe-1 yielded a 9.8-kb band from the wild-type allele and a 5.4-kb band from the targeted allele. (C) Loss of ZO-3 mRNA in the kidney of ZO-3−/− mice examined by RT-PCR. A set of primers that correspond to the sequences within exon 18 and exon 21 was used. A single product with a predicted length was obtained from wild-type (+/+) and heterozygous (+/−) mice but not from homozygous (−/−) mice. As a control, the glyceraldehyde-3-phosphate dehydrogenase (GAPDH) gene was equally amplified in all samples.
FIG. 3.
FIG. 3.
TJs in ZO-3−/− mice. (A) Ultrathin-section electron microscopy. Both ZO-3+/+ (+/+) and ZO-3−/− (−/−) intestinal epithelial cells are well polarized, bearing characteristic microvilli on their apical surface (a and a′) and well-developed junctional complexes at the most apical part of the lateral membranes (arrows). These junctional complexes are composed of TJs, AJs, and desmosomes (DS) as shown at the higher magnification (b and b′). Bars, 1 μm (a and a′) and 200 nm (b and b′). (B) Immunofluorescence microscopy of frozen sections of the ZO-3+/+ (+/+) and ZO-3−/− (−/−) small intestine with antioccludin MAb and anti-ZO-3 PAb. Occludin is concentrated at the TJs irrespective of the occurrence of ZO-3. Bar, 10 μm. (C) Immunofluorescence microscopy of frozen sections of the ZO-3+/+ (+/+) and ZO-3−/− (−/−) kidney with anti-ZO-1 PAb and anti-ZO-3 MAb. ZO-1 is localized normally at TJs of renal tubules in ZO-3−/− mice. Bar, 10 μm. (D) Immunoblotting of lysates of kidney of ZO-3+/+ (+/+) and ZO-3−/− (−/−) mice with anti-ZO-3 PAb, anti-ZO-1 PAb, anti-ZO-2 PAb, anti-claudin-3 PAb, antioccludin MAb, anticingulin MAb, anti-Patj PAb, and anti-γ-tubulin MAb. The expression of ZO-3 was absent in the ZO-3−/− kidney, whereas the expression levels of other junction-associated proteins were indistinguishable between ZO-3+/+ and ZO-3−/− kidneys. Blotting for γ-tubulin was used as a loading control.
FIG. 4.
FIG. 4.
Hematoxylin-eosin-stained sectional images of the lungs (A and A′), kidneys (B and B′), and livers (C and C′) of ZO-3+/+ (+/+) and ZO-3−/− (−/−) mice. In all tissues examined, no significant abnormalities were found in ZO-3−/− mice. Asterisks, glomeruli; arrows, central veins. Bars, 50 μm (A and A′), 100 μm (B, B′, C, and C′).
FIG. 5.
FIG. 5.
Generation of ZO-3−/− F9 cells. (A) Restriction maps of the wild-type allele, the first and second targeting vectors (targeting vector I and II), the Cre-treated allele (Cre allele), and the targeted alleles of the mouse ZO-3 gene. Targeting vector I is the same as that used for the generation of ZO-3−/− mice (see Fig. 2A). Targeting vector II contained an IRES-LacZ/PGK-Neo cassette in the middle and DT-A cassette just on the 3′ side of the 3′ arm to insert the IRES-LacZ/PGK-Neo cassette into exon 3. The positions of 3′probe-1 and 3′probe-2 for Southern blotting are indicated by bars. (B) Genotype analyses by Southern blotting of EcoRI-digested (with 3′probe-1) and PstI-digested (with 3′probe-2) genomic DNA from wild-type (+/+), heterozygous (+/−), Cre-treated heterozygous (+/− Cre), and homozygous (−/−) F9 cells. Southern blotting with 3′probe-1 yielded a 9.8-kb band from the wild-type allele, a 5.4-kb band from the first targeted allele, and a 3.4-kb band from the Cre-treated allele. Southern blotting with 3′probe-2 yielded a 7.1-kb band from the wild-type allele, a 3.9-kb band from the second targeted allele, and no band from the first targeted and the Cre-treated alleles.
FIG. 6.
FIG. 6.
Phenotypic analyses of the visceral endoderm differentiated from ZO-3+/+ and ZO-3−/− F9 cells. (A) Morphology of ZO-3+/+ (+/+) and ZO-3−/− (−/−) F9 cell aggregates. Phase-contrast microscopy (a and a′) showed that ZO-3+/+ and ZO-3−/− cell aggregates were similar in size and appearance. Ultrathin-section electron microscopy (b and b′) revealed at low magnification that both ZO-3+/+ and ZO-3−/− cells delineating the outer surface of cell aggregates (visceral endodermal cells) were polarized with short microvilli on their apical surface (arrows). At higher magnification (c and c′), cell-cell contact sites of ZO-3+/+ and ZO-3−/− visceral endodermal cells were characterized by junctional complexes consisting of TJs, AJs, and desmosomes (DS). Bars: 100 μm (a and a′), 5 μm (b and b′), 200 nm (c and c′). (B) Immunoblotting of whole-cell lysates of ZO-3+/+ (+/+) and ZO-3−/− (−/−) F9 cell aggregates that are cultured for 6 days in the presence (RA+) or absence (RA−) of retinoic acid. Each of the whole-cell lysates was blotted with anti-ZO-3 PAb, anti-ZO-1 PAb, anti-ZO-2 PAb, anti-claudin-3 PAb, antioccludin MAb, anti-cingulin MAb, anti-Patj PAb, and anti-γ-tubulin MAb. Retinoic acid affected the expression levels of many junctional proteins, and their expression patterns were indistinguishable between ZO-3+/+ and ZO-3−/− cells except that the expression of ZO-3 disappeared in ZO-3−/− cells. Blotting for γ-tubulin was used as a loading control. (C) Immunostaining of chimeric cell aggregates formed by coculturing a mixture of ZO-3+/+ and ZO-3−/− cells (a, b, d, e, and f) or a mixture of ZO-3−/− cells exogenously expressing ZO-3 (ZO-3−/−/+ cells) and ZO-3−/− cells (c). These chimeric aggregates were whole-mount stained doubly with anti-ZO-1 MAb-anti-ZO-3 PAb (a), anti-ZO-2 PAb-anti-ZO-3 MAb (b and c), anti-claudin-4 MAb-anti-ZO-3 PAb (d), anticingulin MAb-anti-ZO-3 PAb (e), or anti-Patj PAb-anti-ZO-3 MAb (f). ZO-3+/+ cells and ZO-3−/−/+ cells are marked by asterisks. The concentrations of ZO-1, claudin-4, cingulin, and Patj do not appear to differ between ZO-3-positive and ZO-3-negative TJs (a, d, e, and f). Note that ZO-2 is concentrated in a significantly larger amount at ZO-3-negative TJs between adjacent ZO-3−/− cells than ZO-3-positive TJs between ZO-3+/+ cells (b) or ZO-3−/−/+ cells (c). Bar, 20 μm.
FIG. 7.
FIG. 7.
Phenotypic analyses of F9 cells lacking the expression of ZO-3 and ZO-2 differentiated under monolayer culture conditions. (A) Immunoblotting of whole-cell lysates of ZO-3+/+, ZO-3−/−, ZO-3+/+/ZO-2KD and ZO-3−/−/ZO-2KD F9 cells that are cultured for 7 days in the presence of retinoic acid under monolayer culture conditions. Each of the lysates was blotted with anti-ZO-3 PAb, anti-ZO-1 PAb, anti-ZO-2 PAb, anti-claudin-3 PAb, antioccludin MAb, anticingulin MAb, anti-Patj PAb, and anti-γ-tubulin MAb. Expression patterns of several junctional proteins were indistinguishable among these four cells, except that ZO-3 expression disappeared in ZO-3−/− and ZO-3−/−/ZO-2KD cells and that ZO-2 expression was suppressed in ZO-3+/+/ZO-2KD and ZO-3−/−/ZO-2KD cells. Blotting for γ-tubulin was used as a loading control. (B) Immunostaining of chimeric cell monolayers formed by coculturing a mixture of ZO-3−/− and ZO-3−/−/ZO-2KD cells. These chimeric aggregates were doubly stained with anti-ZO-1 MAb-anti-ZO-2 PAb (a), anti-claudin-4 MAb-anti-ZO-2 PAb (b), anticingulin MAb-anti-ZO-2 PAb (c), or anti-Patj PAb-anti-ZO-2 MAb (d). ZO-3−/− cells are indicated by asterisks. The concentration of ZO-1, claudin-4, cingulin, and Patj does not appear to differ between ZO-2-positive and ZO-2-negative TJs with the ZO-3−/− background. Bar, 20 μm.
FIG. 8.
FIG. 8.
Ca2+ switch experiment. ZO-3+/+, ZO-3−/−, and ZO-3−/−/ZO-2KD cells were cultured under monolayer conditions in the presence of retinoic acid for 7 days. They were then cultured in a low Ca2+ medium containing 5 μM Ca2+ overnight and were transferred to a normal culture medium. After 0.5, 1, 2, and 4 h of incubation, cells were fixed and stained with anti-E-cadherin MAb (A), anti-ZO-1 MAb (B), or anti-Patj PAb (C). Junction formation similarly proceeded in ZO-3+/+, ZO-3−/−, and ZO-3−/−/ZO-2KD cells. Bar, 20 μm.

Similar articles

Cited by

References

    1. Anderson, J. M., and C. M. Van Itallie. 1995. Tight junctions and the molecular basis for regulation of paracellular permeability. Am. J. Physiol. 269:G467-G475. - PubMed
    1. Ando-Akatsuka, Y., S. Yonemura, M. Itoh, M. Furuse, and S. Tsukita. 1999. Differential behavior of E-cadherin and occludin in their colocalization with ZO-1 during the establishment of epithelial cell polarity. J. Cell Physiol. 179:115-125. - PubMed
    1. Balda, M. S., L. González-Mariscal, K. Matter, M. Cereijido, and J. M. Anderson. 1993. Assembly of the tight junction: the role of diacylglycerol. J. Cell Biol. 123:293-302. - PMC - PubMed
    1. Balda, M. S., and K. Matter. 1998. Tight junctions. J. Cell Sci. 111:541-547. - PubMed
    1. Balda, M. S., and K. Matter. 2000. The tight junction protein ZO-1 and an interacting transcription factor regulate ErbB-2 expression. EMBO J. 19:2024-2033. - PMC - PubMed

Publication types

MeSH terms