Comparative Study
. 2006 Oct 2;203(10):2377-89.
doi: 10.1084/jem.20060845. Epub 2006 Sep 25.

Carbon monoxide differentially inhibits TLR signaling pathways by regulating ROS-induced trafficking of TLRs to lipid rafts

Affiliations
Comparative Study

Carbon monoxide differentially inhibits TLR signaling pathways by regulating ROS-induced trafficking of TLRs to lipid rafts

Kiichi Nakahira et al. J Exp Med. .

Abstract

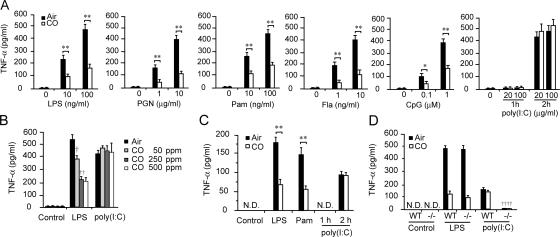
Carbon monoxide (CO), a byproduct of heme catabolism by heme oxygenase (HO), confers potent antiinflammatory effects. Here we demonstrate that CO derived from HO-1 inhibited Toll-like receptor (TLR) 2, 4, 5, and 9 signaling, but not TLR3-dependent signaling, in macrophages. Ligand-mediated receptor trafficking to lipid rafts represents an early event in signal initiation of immune cells. Trafficking of TLR4 to lipid rafts in response to LPS was reactive oxygen species (ROS) dependent because it was inhibited by diphenylene iodonium, an inhibitor of NADPH oxidase, and in gp91(phox)-deficient macrophages. CO selectively inhibited ligand-induced recruitment of TLR4 to lipid rafts, which was also associated with the inhibition of ligand-induced ROS production in macrophages. TLR3 did not translocate to lipid rafts by polyinosine-polycytidylic acid (poly(I:C)). CO had no effect on poly(I:C)-induced ROS production and TLR3 signaling. The inhibitory effect of CO on TLR-induced cytokine production was abolished in gp91(phox)-deficient macrophages, also indicating a role for NADPH oxidase. CO attenuated LPS-induced NADPH oxidase activity in vitro, potentially by binding to gp91(phox). Thus, CO negatively controlled TLR signaling pathways by inhibiting translocation of TLR to lipid rafts through suppression of NADPH oxidase-dependent ROS generation.


Figures

Figure 1.
Figure 1.
Expression of TNF-α and macrophages in the kidneys and livers of HO-1 null mice. Livers and kidneys were harvested from HO-1 null mice (HO-1−/−; n = 3) or wild-type mice (HO-1+/+; n = 3) under untreated conditions, and tissue sections were immunostained with anti–TNF-α or anti–CI:A3-1 for the detection of macrophages/monocytes. Representative light microscopic views are shown. Arrows and arrowheads indicate the influx of macrophages and TNF-α expression, respectively.
Figure 2.
Figure 2.
Effect of HO-1 overexpression on TLR ligand–induced TNF-α production in macrophages. (A) RAW 264.7 cells overexpressing HO-1 or control cells were treated with 100 ng/ml LPS, 100 ng/ml Pam, or 1 μM CpG for 1 h, and culture media were collected for TNF-α measurement. (B) The cells were pretreated with 5 μM of hemoglobin (Hb) for 30 min and stimulated with LPS for 1 h. TNF-α in culture media was measured by ELISA. *, P < 0.05 and **, P < 0.01 versus HO-1–overexpressing cells.
Figure 3.
Figure 3.
Effect of CO on TLR ligand–induced TNF-α production in macrophages. (A) RAW 264.7 cells were pretreated with 250 ppm CO for 2 h, followed by stimulation with the indicated concentrations of TLR ligands. Cell media were collected 1 or 2 h after the ligand treatment and TNF-α was measured by ELISA. *, P < 0.05 and **, P < 0.01 versus CO-treated cells. (B) Cells were treated with various concentrations of CO and stimulated with 100 ng/ml LPS or 20 μg/ml poly(I:C) for 1 or 2 h. TNF-α in the culture media was measured. †, P < 0.05 and ††, P < 0.01 versus LPS-treated control cells. (C) Mouse peritoneal macrophages were pretreated with 250 ppm CO for 2 h, followed by stimulation with TLR ligands for 1 or 2 h. Culture media were collected and TNF-α was measured by ELISA. **, P < 0.01 versus CO-treated cells. (D) Mouse peritoneal macrophages from wild-type (WT) mice or TLR3-deficient mice (−/−) were stimulated with 100 ng/ml LPS or 20 μg/ml poly(I:C) for 1 or 2 h, and TNF-α in culture media was measured by ELISA. ††, P < 0.01 versus poly(I:C)-stimulated wild-type cells.
Figure 4.
Figure 4.
Effect of CO on IRF-3–related cytokine production in macrophages. (A) RAW 264.7 cells were treated with 100 ng/ml LPS or 20 μg/ml poly(I:C) in the absence or presence of CO, and their IFN-β mRNA expression at the indicated time points was analyzed by real-time RT-PCR. (B) IP-10 and RANTES production in culture media was analyzed by ELISA. **, P < 0.01 versus CO-treated cells.
Figure 5.
Figure 5.
CO inhibits activation of NF-κB and nuclear translocation of IRF-3 by LPS, but not by poly(I:C). RAW 264.7 cells were stimulated with 100 ng/ml LPS, 100 ng/ml Pam, 10 ng/ml Fla, 1 μM CpG, and 20 μg/ml poly(I:C) in the presence or absence of CO. Nuclear protein was extracted for NF-κB activation assay or Western blot analysis. (A) NF-κB (p65) activation was analyzed by ELISA-based kits. **, P < 0.01 versus CO-treated cells. (B) NF-κB was analyzed by electrophoretic mobility shift assay. Protein–DNA complexes are shown. Arrowhead indicates nonspecific bands. (C) Nuclear extract was analyzed by immunoblotting for IRF-3 nuclear translocation, followed by stripping and reprobing for upstream stimulatory factor 2 (USF2).
Figure 6.
Figure 6.
Effect of CO on interactions of TLRs and adaptor molecules. RAW 264.7 cells were treated with 100 ng/ml LPS or 20 μg/ml poly(I:C) in the absence or presence of CO. (A) Interaction between TLR4 and MyD88 or TLR4 and TRIF was analyzed with immunoprecipitation and immunoblotting. Expression of TLR4, MyD88, and TRIF was analyzed by immunoblotting using total cell lysates. (B) Interaction of TLR3 and TRIF was analyzed with immunoprecipitation and immunoblotting.
Figure 7.
Figure 7.
Lipid rafts are involved with TLR signaling, but not TLR3. (A) RAW 264.7 cells were stimulated with LPS or poly(I:C) in the presence or absence of CO for 1 h, followed by incubation of FITC-CTx on ice for 10 min. Cells were analyzed for FITC-CTx–stained GM1 (green) and TLR4 or TLR3 (red) by confocal microscopy. (B) RAW 264.7 cells were stimulated with LPS in the presence or absence of CO for 5 min. Cell lysates were fractionated by sucrose-gradient ultracentrifugation, followed by fractionation to 12 subfractions for immunoblotting with flotillin-1, TLR4, and other signaling proteins. (C) RAW 264.7 cells were treated with LPS, CpG, or poly(I:C) for 1 h, and then lipid raft fractions (fractions 3 and 4) and nonraft fractions (fractions 9–12) were separated. TLR3, 4, or 9 was immunoprecipitated with anti-TLR3, 4, or 9 mAb from raft fractions or nonraft fractions, followed by immunoblotting with the anti-TLR3, anti-TLR4, or anti-TRIF mAb. (D) RAW 264.7 cells were pretreated with 15 mM MβCD or medium for 15 min, followed by stimulation with LPS, Pam, or poly(I:C) for 1 or 2 h. Cell media were harvested and TNF-α production was analyzed by ELISA. *, P < 0.05 versus MβCD-treated cells. (E) RAW 264.7 cells were pretreated with 200 μM MDC or methanol as vehicle for 30 min, and then stimulated with LPS, Pam, or poly(I:C) for 1 or 2 h. TNF-α production in cell media was analyzed by ELISA. **, P < 0.01 versus MDC-treated cells.
Figure 8.
Figure 8.
ROS generation is involved with translocation of TLR4 to lipid rafts. (A) RAW 264.7 cells were pretreated with the indicated concentration of NAC or DPI for 30 min, followed by incubation with LPS for 1 h. TNF-α production in cell media was analyzed by ELISA. †, P < 0.05 and ††, P < 0.01 versus LPS-treated control cells. (B) RAW 264.7 cells were pretreated with 2 μM DPI, followed by incubation with LPS, Pam, CpG, or poly(I:C) for 1 or 2 h. TNF-α production in cell media was analyzed by ELISA. **, P < 0.01 versus DPI-treated cells. (C) RAW 264.7 cells were pretreated with 2 μM DPI or DMSO as vehicle for 30 min, followed by incubation with 100 ng/ml LPS. Interaction between TLR4 and TRIF was analyzed with immunoprecipitation assay. (D and E) RAW 264.7 cells were pretreated with 2 μM DPI for 30 min, followed by incubation with 100 ng/ml LPS, 100 μM H2O2, or 1 μM PMA for 1 h. Cell lysates were fractionated to 12 subfractions, followed by immunoblotting for TLR4 and flotillin-1.
Figure 9.
Figure 9.
CO inhibits LPS-induced TLR4 trafficking by inhibiting NADPH oxidase activity. (A) RAW 264.7 cells were incubated with 100 ng/ml LPS, 100 ng/ml Pam, and 20 μg/ml poly(I:C) in the presence or absence of CO after preincubation with 10 μM CM-H2DCFDA for 30 min. Fluorescence intensity of the cells was measured as the amount of ROS accumulation (left). Representative images are shown from three independent experiments (right). *, P < 0.05 and **, P < 0.01 versus CO-treated cells. (B) RAW 264.7 cells were treated with LPS in the presence or absence of CO or DPI. Interaction of gp91phox and p47phox was analyzed by immunoprecipitation assay. (C) RAW 264.7 cells were treated with LPS for 30 min in the presence or absence of CO or DPI. Superoxide production was analyzed by determining the reduction rate of acetylated cytochrome C. ††, P < 0.01 versus LPS-treated control cell. (D) Cytochrome b558 fraction was isolated from bovine neutrophils and the spectra of cytochrome b558 were analyzed. The isolated oxidized cytochrome b558 was reduced by adding 5 mM of sodium dithionite and CO was bubbled for 30 s, followed by spectra analysis (left). The spectral difference between the control (Reduced form) and CO-treated sample (CO Reduced) was shown (right). (E) Peritoneal macrophages were isolated from gp91phox-deficient (gp91phox−/−) mice and wild-type (WT) mice. Cells were exposed to LPS for 1 h in the presence or absence of CO. TNF-α production in cell media was analyzed by ELISA. ††, P < 0.01 versus air/LPS (WT). **, P < 0.01 versus air/LPS (WT). (F and G) RAW 264.7 cells were stimulated with LPS in the presence or absence of DPI or CO, and the interaction of TLR4 and gp91phox was analyzed using immunoprecipitation assay. (H) Peritoneal macrophages from gp91phox-deficient and wild-type mice were stimulated with 100 ng/ml LPS for 5 min. Cell lysates were fractionated to 12 subfractions, followed by immunoblotting for TLR4 and GM1.

Similar articles

Cited by

References

    1. Ryter, S.W., D. Morse, and A.M. Choi. 2004. Carbon monoxide: to boldly go where NO has gone before. Sci. STKE. 2004:RE6. - PubMed
    1. Yachie, A., Y. Niida, T. Wada, N. Igarashi, H. Kaneda, T. Toma, K. Ohta, Y. Kasahara, and S. Koizumi. 1999. Oxidative stress causes enhanced endothelial cell injury in human heme oxygenase-1 deficiency. J. Clin. Invest. 103:129–135. - PMC - PubMed
    1. Poss, K.D., and S. Tonegawa. 1997. Reduced stress defense in heme oxygenase 1-deficient cells. Proc. Natl. Acad. Sci. USA. 94:10925–10930. - PMC - PubMed
    1. Kawashima, A., Y. Oda, A. Yachie, S. Koizumi, and I. Nakanishi. 2002. Heme oxygenase-1 deficiency: the first autopsy case. Hum. Pathol. 33:125–130. - PubMed
    1. Otterbein, L.E., F.H. Bach, J. Alam, M. Soares, H. Tao Lu, M. Wysk, R.J. Davis, R.A. Flavell, and A.M. Choi. 2000. Carbon monoxide has anti-inflammatory effects involving the mitogen-activated protein kinase pathway. Nat. Med. 6:422–428. - PubMed

Publication types