. 2006 Sep 25;174(7):1009-21.
doi: 10.1083/jcb.200509155.

A novel role for phagocytosis-like uptake in herpes simplex virus entry

Affiliations

A novel role for phagocytosis-like uptake in herpes simplex virus entry

Christian Clement et al. J Cell Biol. .

Abstract

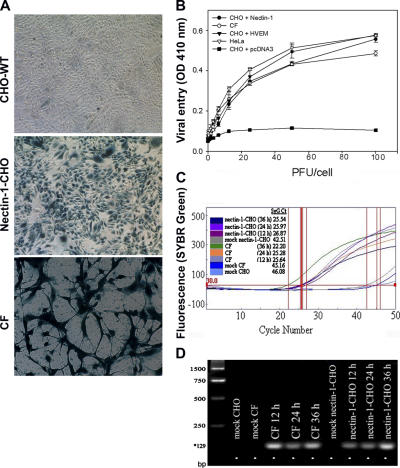
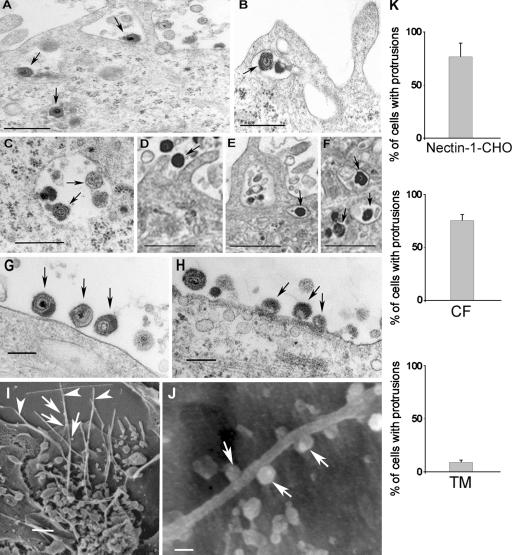
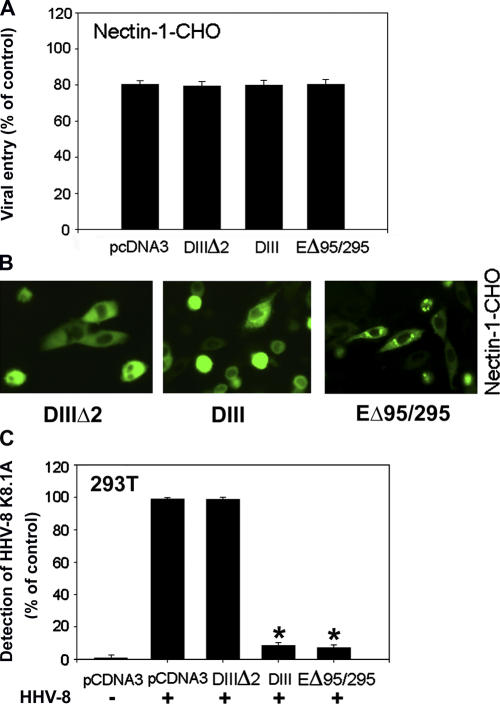
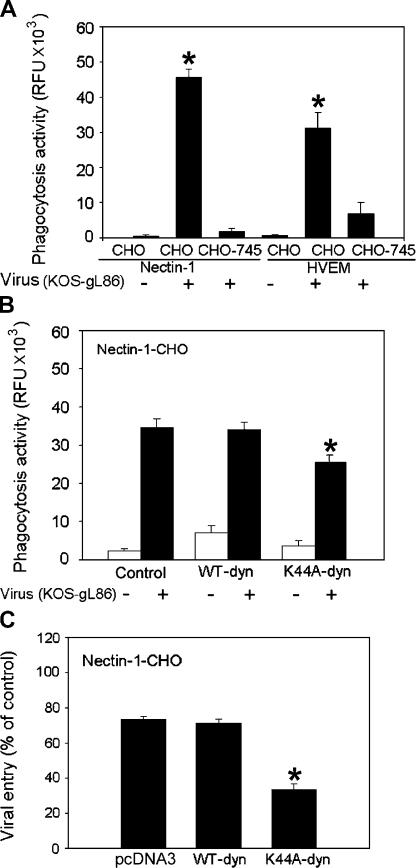
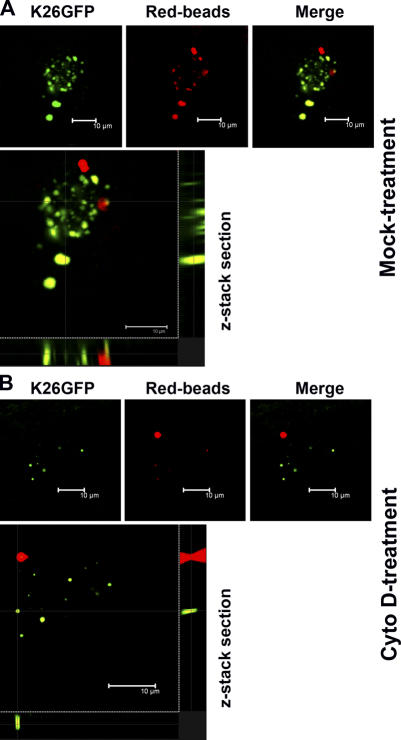
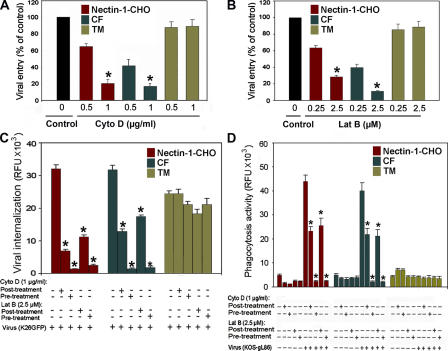
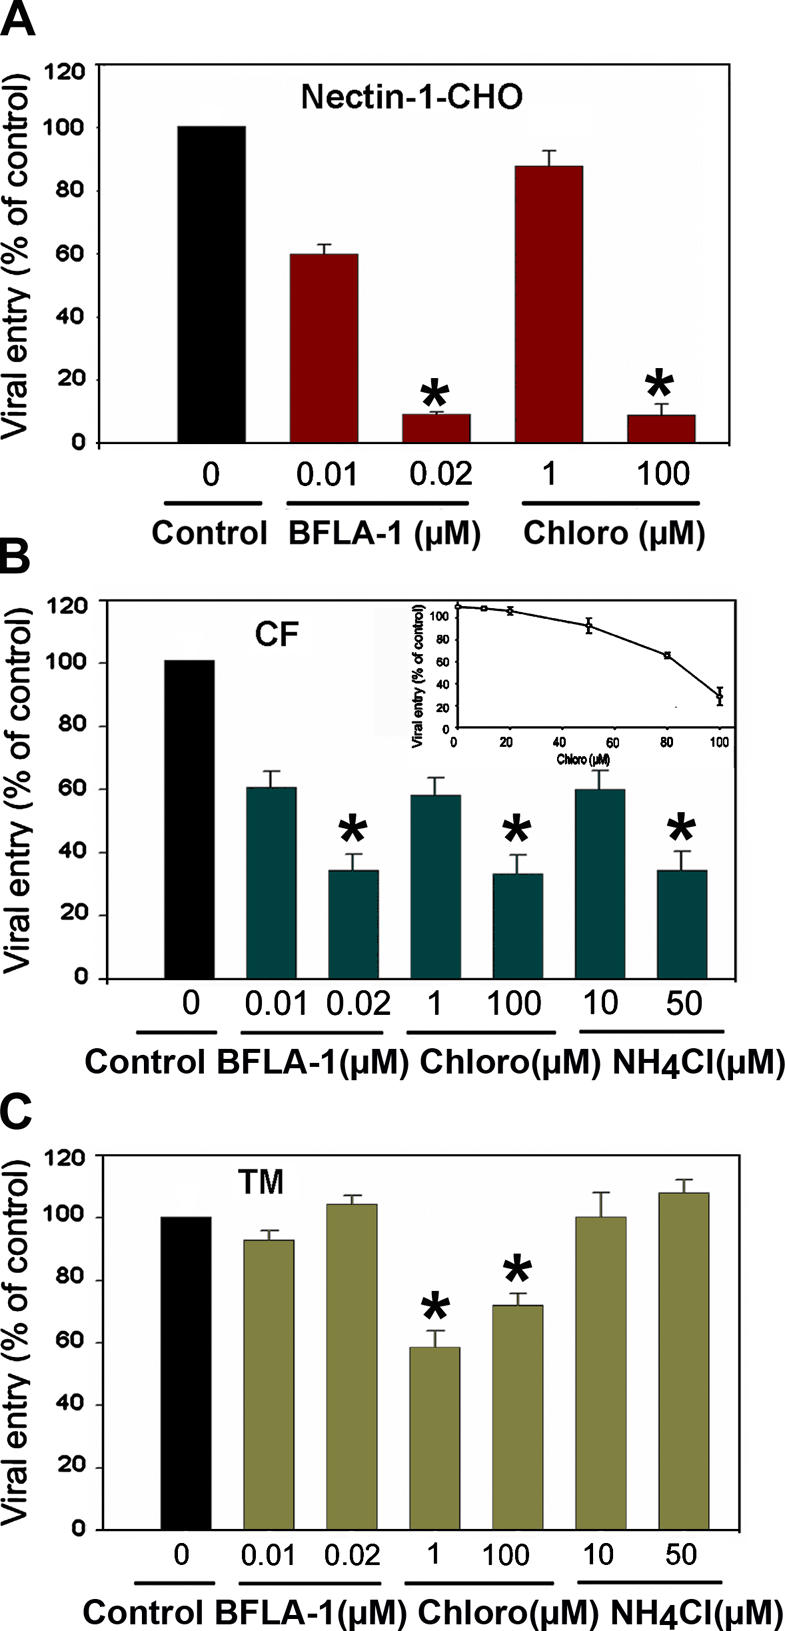
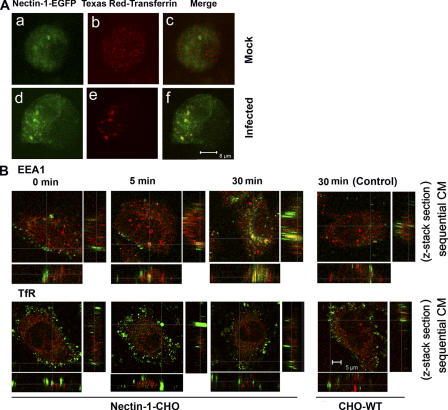
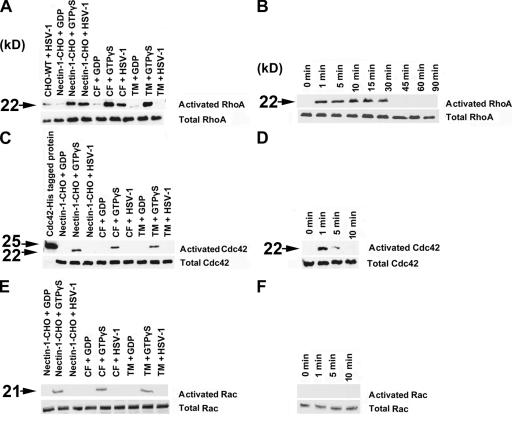
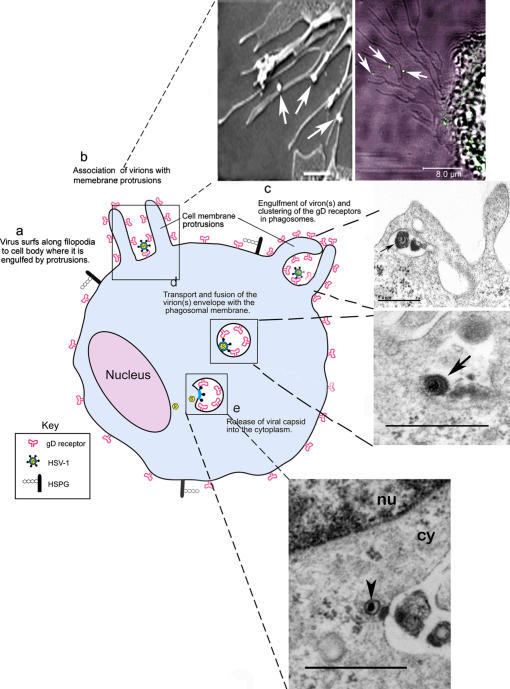
It is becoming increasingly clear that herpesviruses can exploit the endocytic pathway to infect cells, yet several important features of this process remain poorly defined. Using herpes simplex virus-1 (HSV-1) as a model, we demonstrate that endocytosis of the virions mimic many features of phagocytosis. During entry, HSV-1 virions associated with plasma membrane protrusions followed by a phagocytosis-like uptake involving rearrangement of actin cytoskeleton and trafficking of the virions in large phagosome-like vesicles. RhoA GTPase was activated during this process and the mode of entry was cell type-specific. Clathrin-coated vesicles had no detectable role in virion trafficking as Eps15 dominant-negative mutants failed to affect HSV-1 uptake. Binding and fusion of the virion envelope with the phagosomal membrane is likely facilitated by clustering of nectin-1 (or HVEM) in phagosomes, which was observed in infected cells. Collectively, our data suggests a novel mode of uptake by which the virus can infect both professional and nonprofessional phagocytes.


Figures

Figure 1.
Figure 1.
Corneal fibroblasts (CF) exhibit susceptibility to HSV-1 entry. (A) β-galactosidase staining of viral entry. CHO-WT (top panel), nectin-1-CHO (middle panel) and CF (bottom panel) cells were exposed to a recombinant β-galactosidase-expressing HSV-1 (5 PFU/cell) for 6 h followed by incubation with X-Gal (5-bromo-4-chloro-3-indoyl-β-d-galactoside) to identify infected cells (blue). (B) HSV-1 entry curves. As indicated, CF, HeLa, nectin-1-CHO, HVEM-CHO, or pCDNA3-CHO (control) cells in microwells were exposed to HSV-1 at the dosages and time point indicated followed by incubation with ONPG (O-nitro-phenyl β-d-galactopyranoside) which is cleaved by β-gal to galactose and O-nitro-phenol. The individual OD values were within 10% of the mean and represent the amount of reaction product detected by spectrophotometry (OD 410 nm). (C) Replication of HSV-1 in human CF. Real time PCR shows replication of HSV-1 DNA in nectin-1-CHO and CF at times 12, 24, and 36 h. Mock infected cells were used as controls. Fluorescence curve along with CT (threshold cycle; vertical red lines) values are shown for each sample. The parameter CT is defined as the fractional cycle number at which the fluorescence passes the fixed threshold. (D) Visualization of viral DNA. PCR products electrophoresed on 1.5% agarose gel are shown. The amplified products (HSV-1 gD) were of the predicted size (129 bp*). The molecular size standards are shown in the first lane from left.
Figure 2.
Figure 2.
Electron microscopic analysis of HSV-1 entry. TEM (A–H) and SEM (I–J) were performed to analyze HSV-1 entry into cells. Unless otherwise stated, all the images were captured 30 min after infection. (A) Virions (arrows) either bound to a nectin-1-CHO cell surface or loaded in vesicles, bar 0.4 μm. (B) Engulfment of virions (arrow) by protrusions present on the surface of a nectin-1-CHO cell, bar 0.5 μm. (C) Vesicles in nectin-1-CHO cell containing enveloped virions (arrows), bar 0.4 μm. (D–F) CF with membrane protrusions in the vicinity of HSV-1 virions and some enveloped virions in vesicles (arrows), bar 2 μm. (G) Virions (arrows) attaching to a protrusions-less cell surface of a TM cell, bar 0.8 μm. (H) Virions bound and apparently fusing with the plasma membrane of a TM cell, bar 2 μm. (I) Plasma membrane protrusions (arrowheads) from nectin-1-CHO with attached virions (arrows), bar 1 μm. (J) Virions (arrows) attached to a nectin-1-CHO protrusion, bar 100 nm. (K) Determination of percentage of plasma membrane protrusions scored from sampled groups of 250 single cells or clusters (with 5–20 cells), ∼5 μm length of a protrusion and at least 5% of the cell surface covered with protrusions is scored positive.
Figure 3.
Figure 3.
Eps15 mutants do not inhibit HSV-1 entry. (A) Effect of expression of Eps15 mutants. The nectin-1-CHO cells were transfected with either empty vector pcDNA3 or expression plasmids for Eps15 mutants (as indicated) followed by infection with HSV-1 (5 PFU/cell). The entry was measured by β-galactosidase activity. Entry is presented as a percentage of the entry into untransfected cells. (B) Determination of transfection efficiency of plasmids-expressing GFP tagged Eps15 mutants (indicated) into nectin-1-CHO cells. Shown are the snapshots of GFP expressing cells. (C) Effect of the expression of Eps15 mutants on HHV-8 entry. 293 cells were either infected (+) or mock infected (−) with HHV-8 (5 PFU/cell). Un-internalized virions were removed from cell surface using citrate buffer (pH 3). After permeabilization, a mouse monoclonal antibody against HHV-8 glycoprotein, K8.1A (1:500) along with biotinylated secondary antibody and streptavidin-conjugated horseradish peroxidase were used in an ELISA to measure entry using a spectrophotometer. The reaction products generated by the mutants are shown as percentage of control values obtained in triplicates for HHV-8 infected (+) and pcDNA3 transfected cells. Asterisks indicate significant difference from controls (P < 0.05, t test), error bars represent SD.
Figure 4.
Figure 4.
Induction of phagocytosis during HSV entry and the role of dynamin2. Phagocytosis of E. coli K-12 bioparticles was measured in relative fluorescence units (RFU) using 480 nm excitation and 520 nm emission with (+) or without (−) HSV-1. (A) Effect of HSV-1 on phagocytic activity of nectin-1 (or HVEM)-CHO or CHO-745 cells naturally deficient in HS. (B) Effect of K44A-dyn2 or WT-dyn2 expression on phagocytic activity of nectin-1-CHO cells. (C) Effect of expression of K44A-dyn2 or WT-dyn2 expression on virus entry in nectin-1-CHO cells. The data shown are the means of triplicate measures and are representative of 3 independent experiments. Asterisks indicate significant difference from controls (P < 0.05, t test), error bars represent SD.
Figure 5.
Figure 5.
GFP tagged HSV-1 and red fluorescent beads are cointernalized. Nectin-1-CHO cells were either (A) mock treated or (B) treated with Cyto D, before exposure to green fluorescent HSV-1 (K26GFP) and latex beads (Red-beads). Sequential CM was performed to examine z-stacks for virus and beads internalization and colocalization (Merge). A higher magnification of the merged images is also shown (bottom panels).
Figure 6.
Figure 6.
Actin depolymerizers block HSV-1 internalization. Cells were treated with indicated concentrations of Cyto D and Lat B and exposed to HSV-1 (50 PFU/cell). (A) Effects of Cyto D on viral entry into nectin-1-CHO, CF and TM cells. (B) Effects of Lat B on viral entry into nectin-1-CHO, CF and TM cells. The control (Control) represents entry into corresponding mock-treated cells. (C) Effect of Cyto D and Lat B on virus internalization. As indicated cells were treated with Cyto D or Lat B at concentrations indicated for 2 h either after (post-treatment) or before (pre-treatment) exposure to HSV-1 (indicated). The assays were performed either with (+) or without (−) indicated components. Internalization of virions at 37°C after pH 3.0 treatment was quantitated by determining relative fluorescence units (RFU) using a 96-well fluorescence reader. (D) Effect of Cyto D and Lat B on HSV-1 dependent phagocytosis-like uptake of green fluorescent E. coli bioparticles. The extracellular fluorescence was quenched by treatment with trypan blue. The data shown are the means of triplicate measures and are representative of 3 independent experiments. Asterisks indicate significant difference from controls and/or treatments (P < 0.05, t test), error bars represent SD.
Figure 7.
Figure 7.
Lysosomotropic agents block HSV-1 entry. Cells were treated with indicated concentrations of bafilomycin A1 (BFLA-1), chloroquine (Chloro), or ammonium chloride (NH4Cl), and exposed to HSV-1 (50 PFU/cell). Viral entry was quantitated at 3 h after infection. The data shown are the means of triplicate measures and are representative of three independent experiments. The control (Control) represents entry into corresponding mock-treated cells. (A) Effects of lysosomotropic agents on entry into nectin-1-CHO cells. (B) Effects of lysosomotropic agents on entry into CF. The inset shows the effect of intermediary concentrations of chloroquine, a commonly used drug for the treatment of malaria. (C) Effects of lysosomotropic agents on entry into TM cells. Asterisks indicate significant differences from corresponding mock-treated controls (P < 0.05, t test), error bars represent SD.
Figure 8.
Figure 8.
HSV-1 induced clustering of receptor and identification of virions containing vesicles. (A) Nectin-1 colocalizes with early stage vesicles in HSV-1 infected cells. CHO cells transfected with a plasmid expressing nectin-1-EGFP were incubated with Texas red-transferrin conjugate (1:250) for 10 min and then either (a–c) mock infected or (d–f) infected with HSV-1 (50 PFU/cell) for 30 min, fixed and examined by confocal microscopy. Nectin-1 expression is seen in green (a and d) and the early stage vesicles appear red (b and e). In mock-infected cells, merger of green and red shows no colocalization (c), but in infected cells there is colocalization (yellow) (f); (B) HSV-1 colocalizes in early stage vesicles. As indicated, nectin-1-CHO or CHO-WT (Control) cells were infected with HSV-1 (K26GFP) (green) for the time points indicated and then treated with citrate buffer (pH 3) and fixed. It was followed by staining with either anti-EEA1 or anti-TfR (red) to identify the vesicles. By sequential CM the z stacks show colocalization of virions with early stage vesicles. Little colocalization with recycling to late endosomes was observed.
Figure 9.
Figure 9.
Activation of RhoA signaling pathway by HSV-1. Western blot analysis of Rho GTPases. Activation of RhoGTPases (indicated) in the presence of GDP, GTPγS as controls or HSV-1 in cell types (indicated) was determined by affinity precipitation with Rhotekin-RBD-GST or PAK-PBD-GST beads (described in Materials and methods). (A) Activation of RhoA by HSV-1 at 15 min after infection. (B) Time course of HSV-1 induced activation of RhoA from 0 to 90 min in nectin-1-CHO cells. (C) Activation of Cdc42 by HSV-1 at 15 min after infection. (D) Time course of HSV-1 induced activation of Cdc42 from 0 to 10 min in nectin-1-CHO cells. Transient activation of Cdc42 was observed between 1–5 min (E) Activation of Rac1 by HSV-1 at 15 min after infection. (F) Time course of HSV-1 induced activation of Rac1 from 0 to 10 min in nectin-1-CHO cells. As evident, no HSV-1 induced activation of Rac1 was observed.
Figure 10.
Figure 10.
Model for the phagocytic mode of HSV-1 entry. A cartoon (blue) illustrates the major steps (a-e) involved in the phagocytosis-like mode of HSV-1 entry. The panels on the right provide additional ultra-structural evidence to support the model. Top panels: Interaction of HSV-1 (arrows) with nectin-1-CHO cell membrane protrusions. Observations were made by SEM (top left panel, bar 1.0 μm) and by CM (top right panel, bar, 8.0 μm). Middle panels: viral trafficking. TEM images of a virus (arrow) apparently engulfed by the protrusions (top panel) and potentially fusing with the vesicular membrane (bottom panel); bar, 0.6 μm. Bottom panel: viral release. Apparent escape of a nucleocapsid (arrowhead) from a phagosome into the cytoplasm (cy) proximal to the nucleus (nu), bar, 0.6 μm.

References

    1. Akula, S.M., P.P. Naranatt, N.S. Walia, F.Z. Wang, B. Fegley, and B. Chandran. 2003. Kaposi's sarcoma-associated herpesvirus (human herpesvirus 8) infection of human fibroblast cells occurs through endocytosis. J. Virol. 77:7978–7990. - PMC - PubMed
    1. Amer, A.O., and M.S. Swanson. 2002. A phagosome of one's own: a microbial guide to life in the macrophage. Curr. Opin. Microbiol. 5:56–61. - PubMed
    1. Benmerah, A., B. Bègue, A. Dautry-Varsat, and N. Cerf-Bensussan. 1996. The ear of alpha-adaptin interacts with the COOH-terminal domain of the Eps15 protein. J. Biol. Chem. 271:12111–12116. - PubMed
    1. Benmerah, A., C. Lamaze, B. Begue, S.L. Schmid, A. Dautry-Varsat, and N. Cerf-Bensussan. 1998. AP-2/Eps15 interaction is required for receptor-mediated endocytosis. J. Cell Biol. 140:1055–1062. - PMC - PubMed
    1. Benmerah, A., M. Bayrou, N. Cerf-Bensussan, and A. Dautry-Varsat. 1999. Inhibition of clathrin-coated pit assembly by an Eps15 mutant. J. Cell Sci. 112:1303–1311. - PubMed

Publication types

MeSH terms