The age incidence of chronic myeloid leukemia can be explained by a one-mutation model
- PMID: 17001000
- PMCID: PMC1595453
- DOI: 10.1073/pnas.0607006103
The age incidence of chronic myeloid leukemia can be explained by a one-mutation model
Abstract
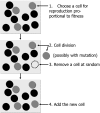
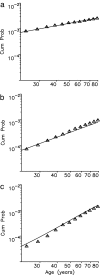
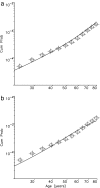
Chronic myeloid leukemia (CML) is associated with the Philadelphia chromosome, which arises by a reciprocal translocation between chromosomes 9 and 22 and harbors the BCR-ABL fusion oncogene. It is unknown whether any other mutations are needed for the chronic phase of the disease. The CML incidence increases as a function of age with an exponent of approximately 3. A slope of 3 could indicate that there are two mutations, in addition to the Philadelphia translocation, that have not yet been discovered. In this work, we explore an alternative hypothesis: We study a model of cancer initiation requiring only a single mutation. A mutated cell has a net reproductive advantage over normal cells and, therefore, might give rise to clonal expansion. The cancer is detected with a probability that is proportional to the size of the mutated cell clone. This model has three waiting times: (i) the time until a mutated cell is produced, (ii) the time of clonal expansion, and (iii) the time until the clone is detected. Surprisingly, this simple process can give rise to cancer incidence curves with exponents up to 3. Therefore, the CML incidence data are consistent with the hypothesis that the Philadelphia translocation alone is sufficient to cause chronic phase CML.
Conflict of interest statement
The authors declare no conflict of interest.
Figures


References
Publication types
MeSH terms
Grants and funding
LinkOut - more resources
Full Text Sources
Medical
Miscellaneous

