Genome-wide functional analysis of human cell-cycle regulators
- PMID: 17001007
- PMCID: PMC1595435
- DOI: 10.1073/pnas.0604320103
Genome-wide functional analysis of human cell-cycle regulators
Abstract
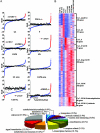
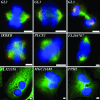
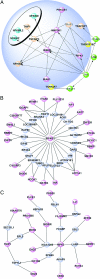
Human cells have evolved complex signaling networks to coordinate the cell cycle. A detailed understanding of the global regulation of this fundamental process requires comprehensive identification of the genes and pathways involved in the various stages of cell-cycle progression. To this end, we report a genome-wide analysis of the human cell cycle, cell size, and proliferation by targeting >95% of the protein-coding genes in the human genome using small interfering RNAs (siRNAs). Analysis of >2 million images, acquired by quantitative fluorescence microscopy, showed that depletion of 1,152 genes strongly affected cell-cycle progression. These genes clustered into eight distinct phenotypic categories based on phase of arrest, nuclear area, and nuclear morphology. Phase-specific networks were built by interrogating knowledge-based and physical interaction databases with identified genes. Genome-wide analysis of cell-cycle regulators revealed a number of kinase, phosphatase, and proteolytic proteins and also suggests that processes thought to regulate G(1)-S phase progression like receptor-mediated signaling, nutrient status, and translation also play important roles in the regulation of G(2)/M phase transition. Moreover, 15 genes that are integral to TNF/NF-kappaB signaling were found to regulate G(2)/M, a previously unanticipated role for this pathway. These analyses provide systems-level insight into both known and novel genes as well as pathways that regulate cell-cycle progression, a number of which may provide new therapeutic approaches for the treatment of cancer.
Conflict of interest statement
Conflict of interest statement: A patent application has been filed for novel cancer drug target genes.
Figures


References
-
- Nurse P, Masui Y, Hartwell L. Nat Med. 1998;4:1103–1106. - PubMed
-
- Sonnichsen B, Koski LB, Walsh A, Marschall P, Neumann B, Brehm M, Alleaume AM, Artelt J, Bettencourt P, Cassin E, et al. Nature. 2005;434:462–469. - PubMed
-
- Boutros M, Kiger AA, Armknecht S, Kerr K, Hild M, Koch B, Haas SA, Consortium HF, Paro R, Perrimon N. Science. 2004;303:832–835. - PubMed
-
- Kim JK, Gabel HW, Kamath RS, Tewari M, Pasquinelli A, Rual JF, Kennedy S, Dybbs M, Bertin N, Kaplan JM, et al. Science. 2005;308:1164–1167. - PubMed
-
- Philips JA, Rubin EJ, Perrimon N. Science. 2005;309:1251–1253. - PubMed
Publication types
MeSH terms
Substances
LinkOut - more resources
Full Text Sources
Other Literature Sources

