

doi: 10.1073/pnas.0602045103.
Epub 2006 Sep 25.
Hormonal activity of AIMP1/p43 for glucose homeostasis
Affiliations
- PMID: 17001013
- PMCID: PMC1595450
- DOI: 10.1073/pnas.0602045103
Item in Clipboard
Hormonal activity of AIMP1/p43 for glucose homeostasis
Proc Natl Acad Sci U S A.
.
Abstract
AIMP1/p43 is known as a cytokine working in the control of angiogenesis, inflammation, and wound healing. Here we report its enrichment in pancreatic alpha cells and glucagon-like hormonal activity. AIMP1 is secreted from the pancreas upon glucose starvation. Exogenous infusion of AIMP1 increased plasma levels of glucose, glucagon, and fatty acid, and AIMP1-deficient mice showed reduced plasma glucose levels compared with the wild-type mice under fasting conditions. Thus, AIMP1 plays a glucagon-like role in glucose homeostasis.
Conflict of interest statement
The authors declare no conflict of interest.
Figures
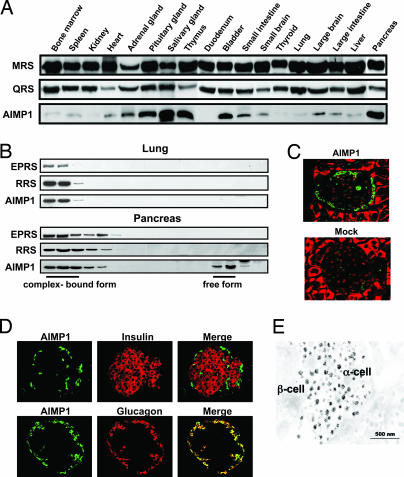
Enriched localization of AIMP1 in pancreatic α cells. (A) Tissue-dependent variations of protein levels were determined for AIMP1 and two tRNA synthetases, methionyl-tRNA synthetase and glutaminyl-tRNA synthetase, which are components of the multi-tRNA synthetase complex. Proteins extracted from each tissue were subjected to Western blot analysis with their respective antibodies. (B) AIMP1 was separated into the portions that were bound and unbound to the multi-tRNA synthetase complex by size exclusion chromatography. The proteins extracted from the lung and pancreas that contained low and high levels of AIMP1, respectively, were compared. The two other components for the complex, glutamyl-prolyl-tRNA synthetase and arginyl-tRNA synthetase, were used as indicators for the complex-bound portion. The eluted proteins were resolved by SDS/PAGE, and three proteins were detected with their respective antibodies. (C) Localization of AIMP1 in the pancreatic islet was determined by immunofluorescence staining. AIMP1 and nuclei were stained green with FITC-conjugated antibody and red with propidium iodide, respectively. (Magnification: ×20.) (D) Colocalization of AIMP1 (green) in the pancreatic α cells with glucagon (red) under a confocal microscope. In Upper, pancreatic β cells were stained with insulin antibody and rhodamine-conjugated secondary antibody. (Magnification: ×20.) (E) A mouse pancreas was dissected and fixed as described in Materials and Methods. Grids were reacted with anti-AIMP1 antibody and detected with colloidal gold-conjugated protein A. The labeled sections were observed under an electron microscope (JEOL) at 80 kV.
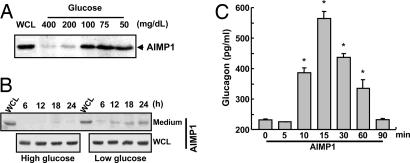
Low glucose levels induce pancreatic secretion of AIMP1. (A) Secretion of AIMP1 by pancreatic stimulation through the cardiac perfusion of the conditioned medium containing the indicated concentrations of glucose. After perfusion of the glucose solution for 5 min at a flow rate of 10 ml/min, pancreases were isolated and incubated as described in Materials and Methods. The secreted proteins were precipitated from the harvested medium by the addition of 10% TCA, separated by 10% SDS/PAGE, and blotted with anti-AIMP1 antibody. WCL, whole-cell lysates. (B) We also confirmed that the secretion of AIMP1 is induced under hypoglycemic conditions (75 mg/dl) from aTC1 clone 9 but not under hyperglycemic conditions (450 mg/dl). (C) Glucagon secretion was stimulated by AIMP1 (100 nM) from aTC1 clone 9. The secreted glucagon was quantified by using an RIA kit (LINCO Research). The values are means ± SD. ∗, P < 0.02.
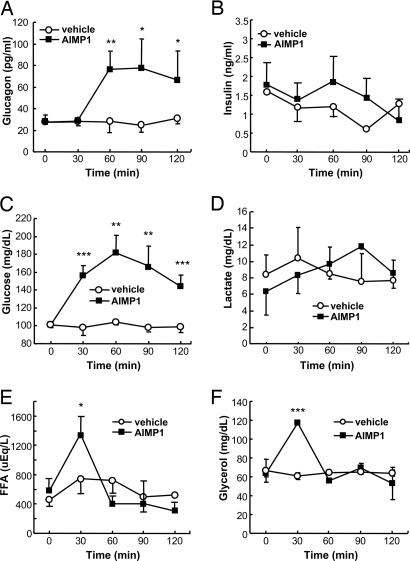
The effect of AIMP1 on the blood levels of hormones and metabolites related to glucose metabolism. Sprague–Dawley rats were cannulated with AIMP1 for 2 h as described in Materials and Methods, blood was collected at the indicated time points, and plasma was obtained by centrifugation. We then measured the plasma levels of glucagon (A), insulin (B), glucose (C), lactate (D), free fatty acid (E), and glycerol (F) using their specific quantification kits (n = 4–5). The values are means ± SD. ∗, P < 0.07; ∗∗, P < 0.05; ∗∗∗, P < 0.02.
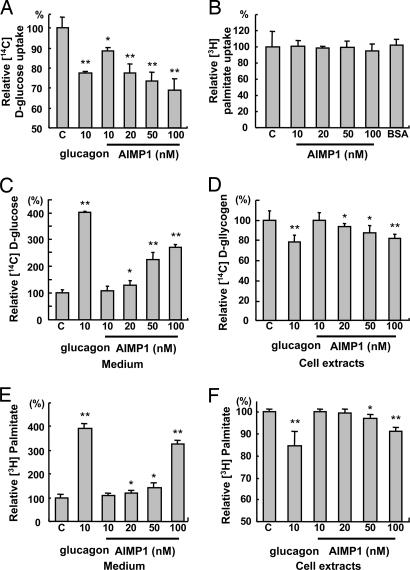
The effect of AIMP1 on glucose uptake, glycogenolysis, and lipolysis. We treated HepG2 with the indicated concentrations of AIMP1 and assayed the uptake rate of [U-14C]d -glucose (A) and [3H]palmitate (B). Glucagon was used as a positive control. We stimulated glycogen synthesis in HepG2 with 10 nM insulin, 25 mM d -glucose, and 2 μCi/ml [U-14C]d -glucose for 16 h, and we induced glycogenolysis by incubating cells with glucose-free DMEM containing glucagon or AIMP1 for 4 h. The culture medium (C) and cells (D) were harvested to quantify [U-14C]d -glucose. We cultured and differentiated 3T3-L1 into adipocytes as described in Materials and Methods. We induced the uptake of [3H]palmitate (1 μCi/ml) for 2 h and treated the cells with glucagon or AIMP1 for 7 h. The culture medium (E) and adipocytes (F) were harvested to measure [3H]palmitate as described in Materials and Methods. The values are means ± SD. ∗, P < 0.06; ∗∗, P < 0.01.
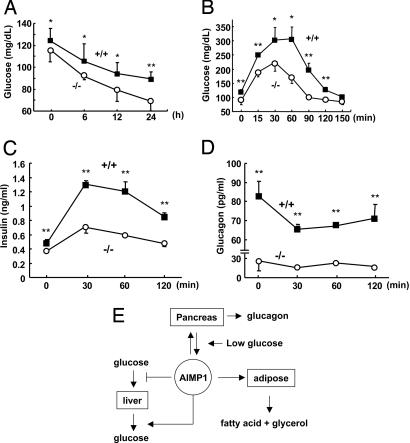
Genetic depletion of AIMP1 induces hypoglycemia. (A) AIMP1+/+ and AIMP1−/− mice were fasted for the indicated times, and blood glucose levels were measured (n = 9). (B) IPGTT in AIMP1+/+ and AIMP1−/− mice. Each group of mice was fasted for 14 h, and 2 g of glucose per kilogram of body weight was i.p. injected in a 20% sterile glucose solution. Blood was harvested at the indicated times, and glucose levels were analyzed (n = 9). Changes of plasma insulin (C) and glucagon (D) levels during IPGTT are shown. (E) Schematic representation of the hormonal activity of AIMP1 working on different organs for glucose homeostasis. AIMP1 released from the pancreatic α cells at low concentrations of glucose to induce glucagon secretion. AIMP1 inhibits glucose uptake, induces glycogenolysis in the liver, and stimulates lipolysis in adipocytes to increase blood levels of glucose. The values are means ± SD. ∗, P < 0.06; ∗∗, P < 0.05.
Similar articles
-
AIMP1 deficiency enhances airway hyperreactivity in mice via increased TH2 immune responses.Clin Immunol. 2012 Jun;143(3):256-65. doi: 10.1016/j.clim.2012.02.004. Epub 2012 Mar 3. Clin Immunol. 2012. PMID: 22472603
-
Aminoacyl-tRNA synthetase-interacting multi-functional protein 1/p43: an emerging therapeutic protein working at systems level.Expert Opin Drug Discov. 2008 Aug;3(8):945-57. doi: 10.1517/17460441.3.8.945. Expert Opin Drug Discov. 2008. PMID: 23484969
-
Inhibition of glucagon secretion.Adv Pharmacol. 2005;52:151-71. doi: 10.1016/S1054-3589(05)52008-8. Adv Pharmacol. 2005. PMID: 16492545 Review.
-
Glucagon-like peptide-2 receptor modulates islet adaptation to metabolic stress in the ob/ob mouse.Gastroenterology. 2010 Sep;139(3):857-68. doi: 10.1053/j.gastro.2010.05.006. Epub 2010 Jun 11. Gastroenterology. 2010. PMID: 20546737
-
Physiology of the pancreatic alpha-cell and glucagon secretion: role in glucose homeostasis and diabetes.J Endocrinol. 2008 Oct;199(1):5-19. doi: 10.1677/JOE-08-0290. Epub 2008 Jul 31. J Endocrinol. 2008. PMID: 18669612 Review.
Cited by
-
AIMP1 promotes multiple myeloma malignancy through interacting with ANP32A to mediate histone H3 acetylation.Cancer Commun (Lond). 2022 Nov;42(11):1185-1206. doi: 10.1002/cac2.12356. Epub 2022 Aug 30. Cancer Commun (Lond). 2022. PMID: 36042007 Free PMC article.
-
Structure of the ArgRS-GlnRS-AIMP1 complex and its implications for mammalian translation.Proc Natl Acad Sci U S A. 2014 Oct 21;111(42):15084-9. doi: 10.1073/pnas.1408836111. Epub 2014 Oct 6. Proc Natl Acad Sci U S A. 2014. PMID: 25288775 Free PMC article.
-
Liver Patt1 deficiency protects male mice from age-associated but not high-fat diet-induced hepatic steatosis.J Lipid Res. 2012 Mar;53(3):358-367. doi: 10.1194/jlr.M019257. Epub 2012 Jan 9. J Lipid Res. 2012. PMID: 22231784 Free PMC article.
-
Anthocyanin inhibits high glucose-induced hepatic mtGPAT1 activation and prevents fatty acid synthesis through PKCζ.J Lipid Res. 2011 May;52(5):908-22. doi: 10.1194/jlr.M013375. Epub 2011 Feb 22. J Lipid Res. 2011. PMID: 21343633 Free PMC article.
-
A novel endogenous damage signal, glycyl tRNA synthetase, activates multiple beneficial functions of mesenchymal stem cells.Cell Death Differ. 2018 Nov;25(11):2023-2036. doi: 10.1038/s41418-018-0099-2. Epub 2018 Apr 17. Cell Death Differ. 2018. PMID: 29666468 Free PMC article.
References
-
- Deutscher MP. Methods Enzymol. 1974;29:577–583. - PubMed
-
- Dang CV, Yang DC. Int J Biochem. 1982;14:539–543. - PubMed
-
- Yang DC, Garcia JV, Johnson YD, Wahab S. Curr Top Cell Regul. 1985;26:325–335. - PubMed
-
- Park SG, Jung KH, Lee JS, Jo YJ, Motegi H, Kim S, Shiba K. J Biol Chem. 1999;274:16673–16676. - PubMed
Publication types
MeSH terms
Substances
LinkOut - more resources
Full Text Sources
Other Literature Sources
Molecular Biology Databases
Miscellaneous
